
Making an Embedded Profiler 1: Surveying Existing Tracing Tools
I highly value fully understanding what a system I’m working on is doing. I wanted to build a portable toolchain to generate system traces. However, this led me to explore dozens of existing tools to avoid needing to write a GUI from scratch.
What Tool am I Looking For
What I’m talking about here is a profiler that logs a series of timestamped events (regions of code being run, thread start/end times, interrupt times, system calls, etc.). These events are then reconstructed in a visual representation of what the system was doing showing the cause and effect of locks, CPU contention, etc.
Rather than build a tool from scratch, I wanted to see if I could extend an existing tool to focus on getting something working for my use case with minimal effort. This led me to survey the existing tracing profilers currently out there.
There’s a few variations on these tools that I wanted to discuss up front.
Sampling Vs. Instrumentation
First there’s how the data is collected. Tools like perf use sampling to periodically check what the system is doing. These tools are great since they usually need minimal/no integration into the applications to be monitored and can be extremely lightweight. The downside is that they might miss events that occur between samples, and they may not have the exact timing.
The alternative is using instrumentation to report the events when they occur. For the embedded use case, having the precise timing of events is key, so I decided that instrumentation makes the most sense and I will be focussing on this approach.
OS Vs. App Profiling
Another choice is whether to collect data from the OS, the app being profiled, or both. Getting data from the OS gives the external context like info on the scheduler and interrupts. You get some idea of what individual processes and threads are doing, but without internal details.
Adding profiling inside an app can give the application specific context about what parts of the code are running, and what sorts of locks are being held.
I use the word app here to be a bit generic. On Linux an app would likely be one or more processes. In an embedded system, the OS might be FreeRTOS while the app is the tasks being run.
Many tools are meant to collect/visualize data from one of these sources, but not both. My goal is to be able to capture both OS and application profiling.
Feature Lists
Like most of my projects, one of the hardest parts is figuring out how to just work on the part I’m interested in.
I’m interested in making a library for instrumenting embedded code. The library should be able to report the profiling data over serial, JTAG, or coredumps. Ideally, the way the profiling is reported could be modular. The library should also be able to be tested in Linux.
Since I’m not at all interested in is the GUI display application, I want to find a project that supports a display I would be able to feed my data into.
Required Features:
- Display what is running on each core
- A way to see what section of code the app is running (can be manually defined regions instead of actual call stack)
- Show multiple threads
- Should have a free license for non-commercial use
Nice to Have Features:
- Show system events like scheduler and interrupts
- Show locks and lock contention
- Show log messages
- Show other profiling info like memory usage, or custom counters
- Open source codebase
Feature I Don’t Care About:
- Ability to show data in realtime
After looking at a bunch of projects, three stood out as the most promising.
SEGGER SystemView
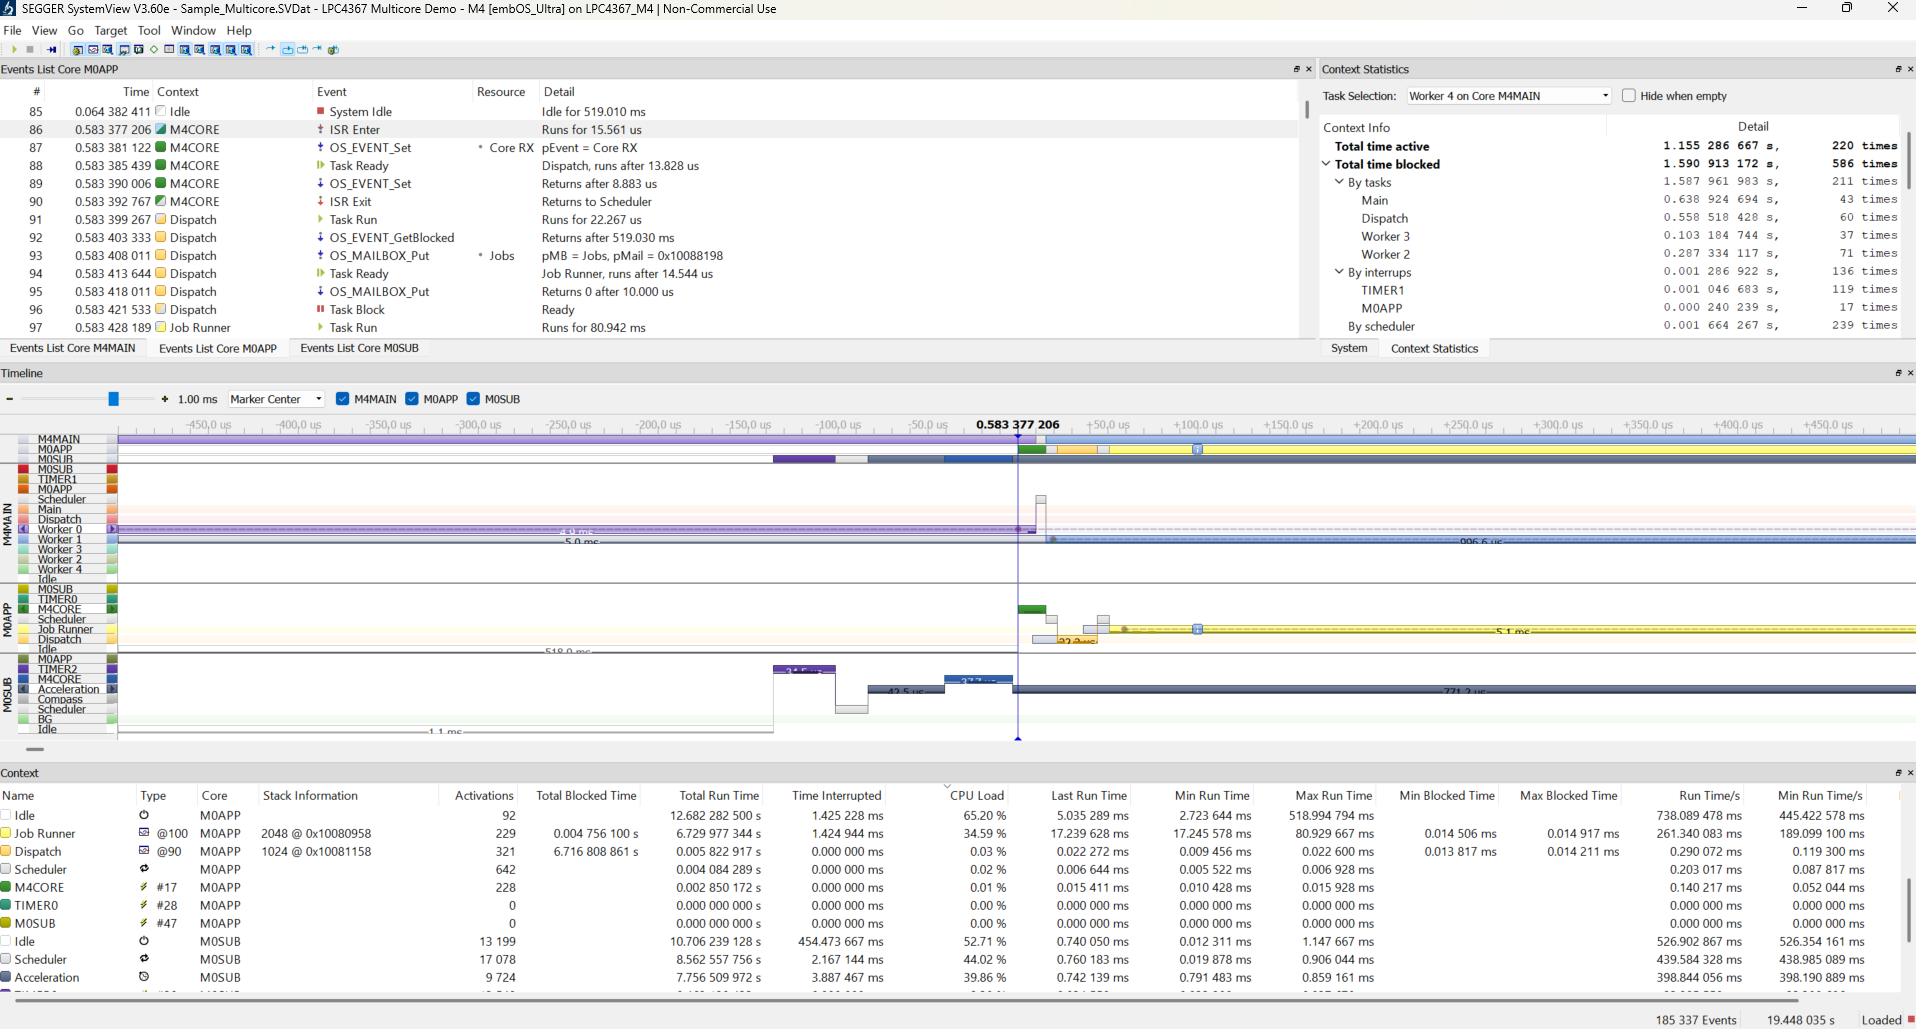
My point of reference for a tracing profiler is the SEGGER SystemView.
I’ve used this in the past, and it’s what motivated me to do this project. It’s so close to being good enough, and would probably work for my use case with minimal work.
The main problem is that this is a tool to make you want to buy into their ecosystem. It is mainly meant to work over their JTAG products, and isn’t meant to support uses outside their tools.
How it Works
You integrate their profiling library to your embedded build as C source code. They provide instrumentation to many RTOS out of the box.
This library writes the events to a ring buffer reserved in the RAM. This can either be read in realtime using the JLINK JTAG tool, or captured in a core dump.
The captured data can be logged to a file, or fed directly into the display.
Pros:
- The instrumentation source code is available
- Optimized for embedded applications
- Existing embedded examples
- Free non-commercial license
- Can show logs and user counters
- Can shows all desired system level features
Cons:
- Profiling is tightly coupled to SEGGER tools
- The profiler data protocol is not well documented
- Viewer is slightly clunky desktop application
- Viewer is closed source
- Doesn’t show sections of code being executed
Tracy
Tracy https://github.com/wolfpld/tracy is an amazing open source profiling project. While it is primarily focussed on game development, it is very useful for any application.
The basic idea for Tracy is that it is built into the application project through CMake. When enabled, it will create a TCP server which will send profiling data when connected to. This can be logged, or displayed in realtime.
To better understand this, I made a sample program:
CMakeLists.txt:
1
2
3
4
5
6
7
8
9
10
11
12
13
14
15
16
17
18
19
cmake_minimum_required(VERSION 3.10.0)
project(cpp_trace VERSION 0.1.0 LANGUAGES C CXX)

set(CMAKE_BUILD_TYPE Debug)

include_directories(
  tracy/public
)

option(TRACY_ENABLE "" ON)
# My sample app exits quickly, so wait for profiler.
option(TRACY_NO_EXIT "" ON)
option(TRACY_VERBOSE "" ON)

add_subdirectory(tracy)

add_executable(cpp_trace tracy/public/TracyClient.cpp main.cpp)

target_link_libraries(cpp_trace PUBLIC Tracy::TracyClient )
main.cpp:
1
2
3
4
5
6
7
8
9
10
11
12
13
14
15
16
17
18
19
20
21
22
23
24
25
26
27
28
29
30
31
32
33
34
35
36
37
38
39
40
41
42
43
44
45
46
47
48
49
50
51
52
53
54
55
56
57
58
59
60
61
62
63
64
65
66
67
68
#include <iostream>
#include <thread>
#include <mutex>
#include <condition_variable>
#include <queue>

#include <common/TracySystem.hpp>
#include <tracy/Tracy.hpp>

using namespace tracy;

std::queue<int> message_queue;
// This instruments the mutex to report its usage to tracy.
TracyLockableN(std::mutex , mtx, "MyDataLock");
using MyLockType = decltype(mtx);

std::condition_variable_any cv;
bool done = false;

void producer() {
    // This calls pthread_setname_np under the hood and adds some tracy meta data.
    SetThreadName("producer");
    ZoneScoped;
    for (int i = 0; i < 10; ++i) {
        std::this_thread::sleep_for(std::chrono::milliseconds(100));
        {
            std::lock_guard<MyLockType> lock(mtx);
            message_queue.push(i);
            std::cout << "Produced: " << i << std::endl;
        }
        // An additional message to show.
        TracyMessageL("Produced");
        cv.notify_one();
    }
    {
        std::lock_guard<MyLockType> lock(mtx);
        done = true;
    }
    TracyMessageL("NotifyDone");
    cv.notify_one();
}

void consumer() {
    SetThreadName("consumer");
    // pthread_setname_np( pthread_self(), name );
    while (true) {
        ZoneScoped;
        std::unique_lock<MyLockType> lock(mtx);
        TracyMessageL("Wait");
        cv.wait(lock, []{ return !message_queue.empty() || done; });
        while (!message_queue.empty()) {
            int msg = message_queue.front();
            message_queue.pop();
            std::cout << "Consumed: " << msg << std::endl;
        }
        if (done) break;
    }
}

int main(int, char**) {
    std::thread prod(producer);
    std::thread cons(consumer);

    prod.join();
    cons.join();

    std::cout << "All messages processed.\n";
}
I actually had some issue compiling the display from source. It required a newer CMake and GCC then I was using, so I just downloaded a release binary instead.
Here’s a snapshot of the profiling of my sample app:
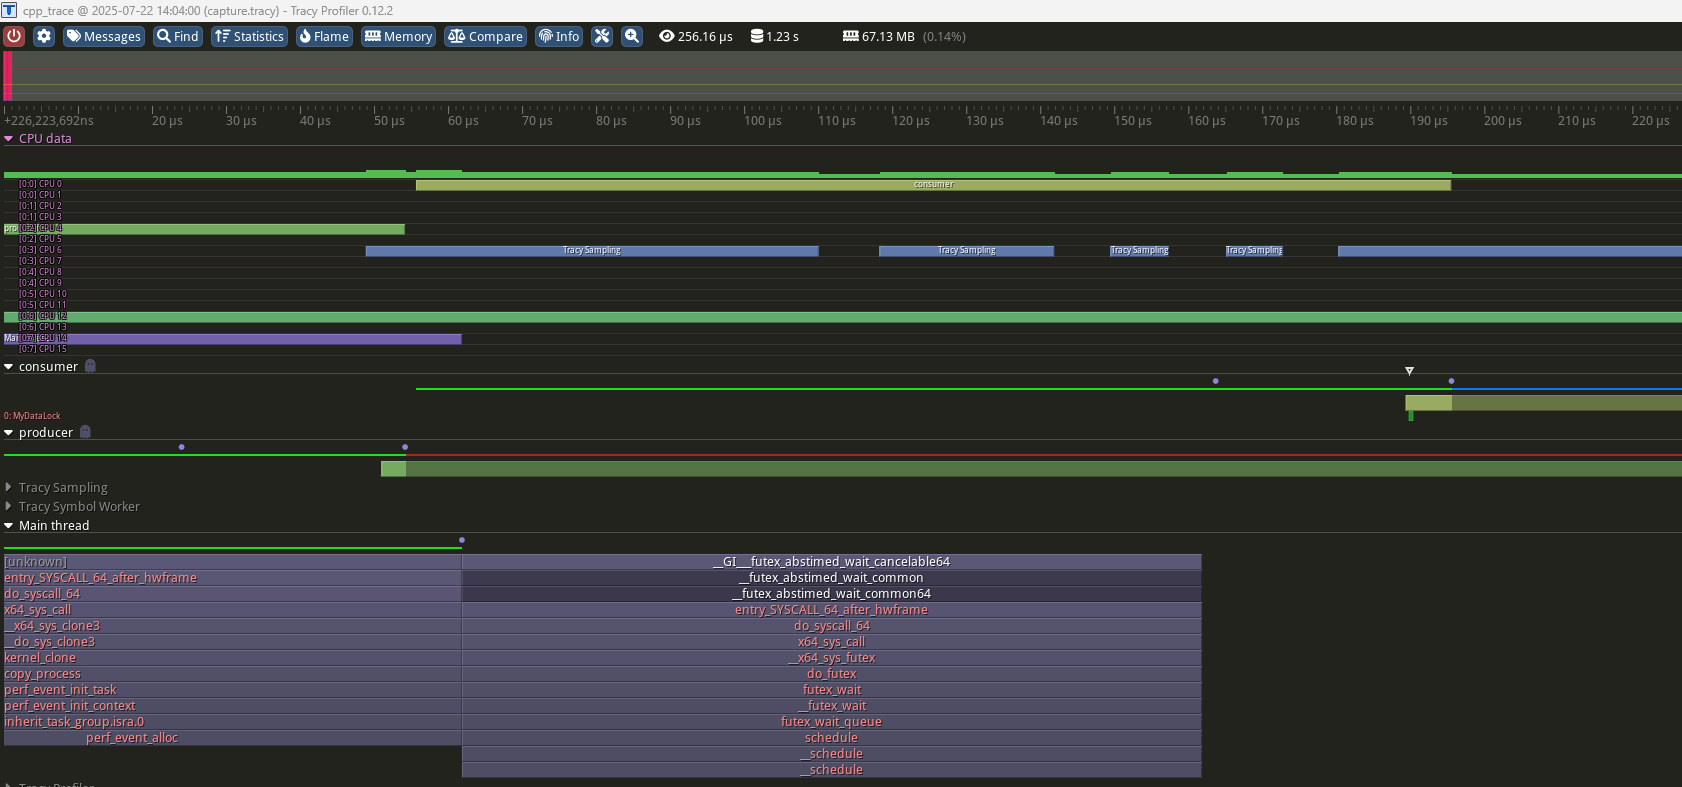
It has all the data I’m interested in, and does a great job at giving you additional context like where every system call occurs and the full call stack.
The next step was to figure out how I could feed data into Tracy since TCP isn’t great for an embedded system.
First I looked at how logged data is loaded: https://github.com/wolfpld/tracy/blob/master/server/TracyWorker.cpp#L7868 . Unfortunately, this is an extremely convoluted format. It is certainly possible I could replicate it, but it seems fairly time consuming, and would likely be brittle to future changes.
Tracy does support tools for converting from a few other formats. Of particular interest was the Fuchsia trace format which actually seems suitable for embedded applications: Tracy Fuchsia import tool.
However, when I dug into this, only a subset of the data is actually loaded. This is a limitation at even the lower levels that limits what can be loaded outside of the full tracy log dump.
Pros:
- Open source
- Display all data of interest
- Easy to integrate into PC C++ applications
Cons:
- Difficult to get rich data into display from external source
Perfetto
Perfetto is a bit of a weird beast to come out of Google. I didn’t find Perfetto directly, but several other projects used it as a GUI for their data collection, similar to how I want to use it.
Perfetto appears to be the evolution of <chrome://tracing>, with the additional inclusion of being able to profile Android systems as well. From there they seem to have specifically made it to be a general purpose trace display tool.
One nice feature for it, is that it runs locally in your browser https://ui.perfetto.dev/ so it’s easy to play around with without installing anything.
The documentation https://perfetto.dev/docs/ is actually very good, but I found it’s mix of use cases still made it hard to get my head around. The problem is that while showing basic traces is very straight forward, it supports showing CPU utilization and OS scheduling, but doesn’t explain how to generate data with this functionality.
Perfetto supports a ton of use cases:
- You use its
traceboxtool to capture data from Linux or Android (including manual trace points compiled into apps) - Dumping data from Chrome
- Ingesting logs from other profiling tools like
perforftrace - Ingesting logs from custom applications meant for Perfetto
I am only interested in the last option, but looking at the built in examples, I couldn’t see how to generate logs with the CPU profiling.
The easiest way to feed in data, is to use the chrome trace event format. This is fairly easy to understand and gives a reasonable way to specify traces. However, it has no way to specify CPU usage.
The documentation highly recommends using the trace Protobuf format, but it’s enormous (like 500 pages). Most of the fields are extremely specific to certain use cases (AndroidCameraSessionStats, ChromeProcessDescriptor, etc.), and they don’t directly address the use case I’m interested in of linking code to the CPU it’s running on.
However, I did find that displaying ftrace data would give the displays I was interested in.
From this I decided to reverse engineer how the data was being used to generate the plots.
Basically, trying to figure out how https://perfetto.dev/docs/data-sources/cpu-scheduling portions of the UI were generated.
Problems Loading Ubuntu 22.04 ftrace
One thing I found a bit annoying, was that I couldn’t display ftrace data captured on my system using their example commands.
I could profile my sample application by running:
1
2
3
sudo trace-cmd record -e sched -e syscalls ./build/cpp_trace
trace-cmd report > my_ftrace_log.txt
grep -e '167782' -e '167783' -e '167784' my_ftrace_log.txt > my_ftrace_log_filtered.txt
but the resulting my_ftrace_log.txt wouldn’t load in perfetto. After quite a bit of digging I realized the issue was that for some reason trace-cmd was using a different format and header then Perfetto expected. Since the manual example in https://perfetto.dev/docs/getting-started/other-formats#linux-ftrace-textual-format didn’t even run, I tried this:
1
2
3
4
5
6
sudo -s
echo 0 > /sys/kernel/tracing/tracing_on
echo nop > /sys/kernel/tracing/current_tracer
echo 'sched:*' > /sys/kernel/tracing/set_event
echo 1 > /sys/kernel/tracing/tracing_on; ./build/cpp_trace; echo 0 > /sys/kernel/tracing/tracing_on
cat /sys/kernel/tracing/trace > my_ftrace_log.txt
See https://docs.kernel.org/trace/events.html
While that loaded, it didn’t seem to populate the events correctly, so I’m guessing it’s a difference in the formatting of the event strings. At this point I gave up, since I could use Android example built into Perfetto, and the ftrace’s I collected for reference.
Reverse Engineering CPU Trace Display
The Python examples for generating the trace Protobuf format were a good starting point:
- https://perfetto.dev/docs/getting-started/converting
- https://perfetto.dev/docs/reference/synthetic-track-event
I downloaded the android example protobuf, and tried loading it in Python to see what it’s contents were. From there I made a script to filter and truncate it to see if I could get a minimal test file that still populated the CPU charts:
1
2
3
4
5
6
7
8
9
10
11
12
13
14
15
16
17
18
19
20
21
22
23
24
25
26
27
28
29
30
31
32
33
34
35
36
37
38
39
40
41
42
43
44
45
46
47
48
49
50
51
52
53
54
55
56
57
from perfetto.protos.perfetto.trace.perfetto_trace_pb2 import Trace

in_file = 'example_android_trace_15s'
end_time_sec = 0.01
try:
    with open(in_file, 'rb') as f:
        binary_data = f.read()

    # Load the example data
    my_message = Trace()
    # Add desired data to the new truncated message
    out_message = Trace()

    my_message.ParseFromString(binary_data)
    print(len(my_message.packet))
    types = set()
    ftraces = set()
    t0 = None
    for item in my_message.packet:
        set_field_name = item.WhichOneof('data')
        types.add(set_field_name)
        # Filter the top level trace category
        # Seen in example:
        # {'ftrace_events', 'clock_snapshot', 'trace_stats', 'ftrace_stats', 'synchronization_marker', 'system_info', 'process_stats', 'process_tree', 'trace_config'}
        if set_field_name in ('process_tree', 'ftrace_events'):
            if set_field_name == 'ftrace_events':
                drops = []
                for event in item.ftrace_events.event:
                    set_event_name = event.WhichOneof('event')
                    ftraces.add(set_event_name)
                    # Filter the ftrace event type
                    # Seen in example:
                    # {'mdp_perf_set_panic_luts', 'sched_wakeup', 'mdp_perf_update_bus', 'mdp_compare_bw', 'oom_score_adj_update', 'task_rename', 'print', 'mdp_perf_set_qos_luts', 'sched_wakeup_new', 'sched_waking', 'mdp_cmd_wait_pingpong', 'sched_switch', 'mdp_commit', 'mdp_mixer_update', 'mdp_cmd_pingpong_done', 'tracing_mark_write', 'sched_process_free', 'cpu_idle', 'mdp_cmd_kickoff', 'mdp_cmd_readptr_done', 'task_newtask', 'mdp_sspp_change', 'sched_process_exit', 'mdp_trace_counter', 'cpu_frequency'}
                    # Can add cpu_frequency for the CPU frequency graphs
                    if set_event_name not in {'cpu_idle', 'sched_switch', 'sched_process_free', 'sched_wakeup_new', 'sched_wakeup', 'sched_waking'}:
                        drops.append(event)
                    else:
                        if t0 is None:
                            t0 = event.timestamp
                        else:
                            if event.timestamp - t0 > end_time_sec * 1e9:
                                drops.append(event)
                for drop in drops:
                    item.ftrace_events.event.remove(drop)

            out_message.packet.append(item)

    # List contents of original file
    print(types)
    print(ftraces)

    output_filename = "example_android_trace_15s_trunc.pftrace"
    with open(output_filename, 'wb') as f:
        f.write(out_message.SerializeToString())

except FileNotFoundError:
    print(f"Error: File '{in_file}' not found.")
I found for my purpose, I only needed the ftrace_events (process_tree events could help populate process/thread names). From the ftrace, it seemed like only the sched_* events were being used, and that I could get the basic functionality with sched_switch alone. The additional sched events could add some additional context, especially about when threads were runnable.
From this I made a small demo:
1
2
3
4
5
6
7
8
9
10
11
12
13
14
15
16
17
18
19
20
21
22
23
24
25
26
27
28
29
30
31
32
33
34
35
36
37
38
39
40
41
42
43
44
45
46
47
48
49
50
51
52
53
54
55
56
57
58
59
60
61
62
63
64
65
66
67
68
69
70
71
72
73
74
75
76
77
78
79
80
81
82
83
84
85
86
87
88
89
90
91
92
93
94
95
96
97
98
99
100
101
102
103
104
105
106
107
108
109
110
111
112
113
114
115
116
117
118
119
120
121
122
123
124
125
126
127
128
129
import uuid

from perfetto.trace_builder.proto_builder import TraceProtoBuilder
from perfetto.protos.perfetto.trace.perfetto_trace_pb2 import TrackEvent, FtraceEvent,  SchedSwitchFtraceEvent


def populate_packets(builder: TraceProtoBuilder):
    TRUSTED_PACKET_SEQUENCE_ID = 8009

    # --- Define OS Process and Thread IDs and Names ---
    APP_PROCESS_ID = 1234
    APP_PROCESS_NAME = "MyApplication"
    MAIN_THREAD_ID = 5678
    MAIN_THREAD_NAME = "MainWorkLoop"
    # Dummy value
    PRIO = 120

    # --- Define UUIDs for the tracks ---
    # While not strictly necessary to parent a thread track to a process track
    # for the UI to group them by PID, defining a process track can be good practice
    # if you want to name the process explicitly or attach process-scoped tracks later.
    app_process_track_uuid = uuid.uuid4().int & ((1 << 63) - 1)
    main_thread_track_uuid = uuid.uuid4().int & ((1 << 63) - 1)

    # 1. Define the Process Track (Optional, but good for naming the process)
    packet = builder.add_packet()
    packet.timestamp = 14998
    desc = packet.track_descriptor
    desc.uuid = app_process_track_uuid
    desc.process.pid = APP_PROCESS_ID
    desc.process.process_name = APP_PROCESS_NAME

    # 2. Define the Thread Track
    # The .thread.pid field associates it with the process.
    # No parent_uuid is set here; UI will group by PID.
    packet = builder.add_packet()
    packet.timestamp = 14999
    desc = packet.track_descriptor
    desc.uuid = main_thread_track_uuid
    # desc.parent_uuid = app_process_track_uuid # This line is NOT used
    desc.thread.pid = APP_PROCESS_ID
    desc.thread.tid = MAIN_THREAD_ID
    desc.thread.thread_name = MAIN_THREAD_NAME

    # Helper to add a slice event to a specific track
    def add_slice_event(ts, event_type, event_track_uuid, name=None):
        packet = builder.add_packet()
        packet.timestamp = ts
        packet.track_event.type = event_type
        packet.track_event.track_uuid = event_track_uuid
        if name:
            packet.track_event.name = name
        packet.trusted_packet_sequence_id = TRUSTED_PACKET_SEQUENCE_ID

    # 3. Emit slices on the main_thread_track_uuid
    add_slice_event(ts=15000, event_type=TrackEvent.TYPE_SLICE_BEGIN,
                    event_track_uuid=main_thread_track_uuid, name="ProcessInputEvent")
    # Nested slice
    add_slice_event(ts=15050, event_type=TrackEvent.TYPE_SLICE_BEGIN,
                    event_track_uuid=main_thread_track_uuid, name="UpdateState")
    add_slice_event(ts=15150, event_type=TrackEvent.TYPE_SLICE_END,  # Ends UpdateState
                    event_track_uuid=main_thread_track_uuid)
    add_slice_event(ts=15200, event_type=TrackEvent.TYPE_SLICE_END,  # Ends ProcessInputEvent
                    event_track_uuid=main_thread_track_uuid)

    add_slice_event(ts=16000, event_type=TrackEvent.TYPE_SLICE_BEGIN,
                    event_track_uuid=main_thread_track_uuid, name="RenderFrame")
    add_slice_event(ts=16500, event_type=TrackEvent.TYPE_SLICE_END,
                    event_track_uuid=main_thread_track_uuid)

    # --- Define a Custom Counter Track parented to the Process ---
    db_connections_counter_track_uuid = uuid.uuid4().int & ((1 << 63) - 1)

    packet = builder.add_packet()
    desc = packet.track_descriptor
    desc.uuid = db_connections_counter_track_uuid
    desc.parent_uuid = app_process_track_uuid  # Link to the process track
    desc.name = "Active DB Connections"
    # Mark this track as a counter track
    desc.counter.unit_name = "connections"  # Optional: specify units

    # Helper to add a counter event
    def add_counter_event(ts, value, counter_track_uuid):
        packet = builder.add_packet()
        packet.timestamp = ts
        packet.track_event.type = TrackEvent.TYPE_COUNTER
        packet.track_event.track_uuid = counter_track_uuid
        packet.track_event.counter_value = value
        packet.trusted_packet_sequence_id = TRUSTED_PACKET_SEQUENCE_ID

    # 3. Emit counter values on the custom counter track
    add_counter_event(ts=15000, value=5, counter_track_uuid=db_connections_counter_track_uuid)
    add_counter_event(ts=15200, value=7, counter_track_uuid=db_connections_counter_track_uuid)
    add_counter_event(ts=16000, value=6, counter_track_uuid=db_connections_counter_track_uuid)

    def add_scheduled_period(events, start, stop, name, pid):
        # The state does effect the status the thread is shown as between runs
        events.append(FtraceEvent(timestamp=start, pid=0, sched_switch=SchedSwitchFtraceEvent(
            next_comm=name, next_pid=pid, next_prio=PRIO, prev_comm='swapper', prev_pid=0, prev_prio=PRIO, prev_state=0)))
        events.append(FtraceEvent(timestamp=stop, pid=pid, sched_switch=SchedSwitchFtraceEvent(
            next_comm="swapper", next_pid=0, next_prio=PRIO, prev_comm=name, prev_pid=pid, prev_prio=PRIO, prev_state=2)))

    packet = builder.add_packet()
    packet.ftrace_events.cpu = 0
    add_scheduled_period(packet.ftrace_events.event, 15000, 15200, MAIN_THREAD_NAME, MAIN_THREAD_ID)

    packet = builder.add_packet()
    packet.ftrace_events.cpu = 1
    add_scheduled_period(packet.ftrace_events.event, 16000, 16500, MAIN_THREAD_NAME, MAIN_THREAD_ID)


def main():
    """
    Initializes the TraceProtoBuilder, calls populate_packets to fill it,
    and then writes the resulting trace to a file.
    """
    builder = TraceProtoBuilder()
    populate_packets(builder)

    output_filename = "my_custom_trace.pftrace"
    with open(output_filename, 'wb') as f:
        f.write(builder.serialize())

    print(f"Trace written to {output_filename}")
    print(f"Open with [https://ui.perfetto.dev](https://ui.perfetto.dev).")


if __name__ == "__main__":
    main()
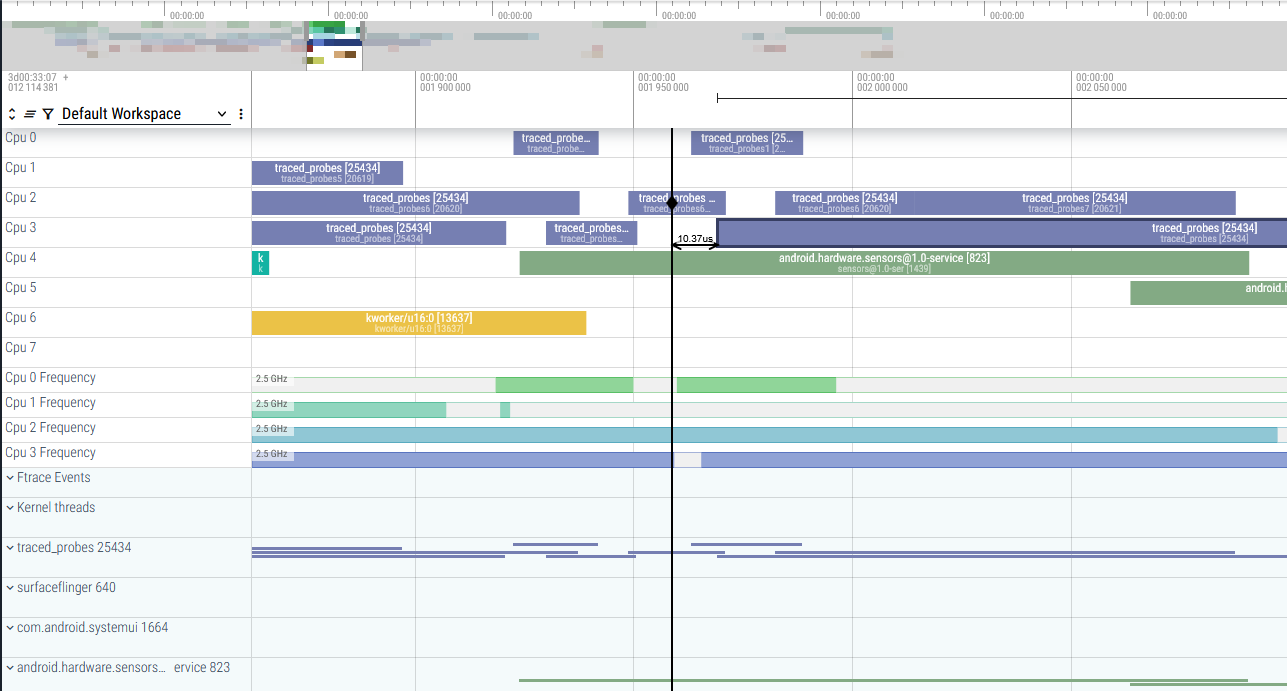
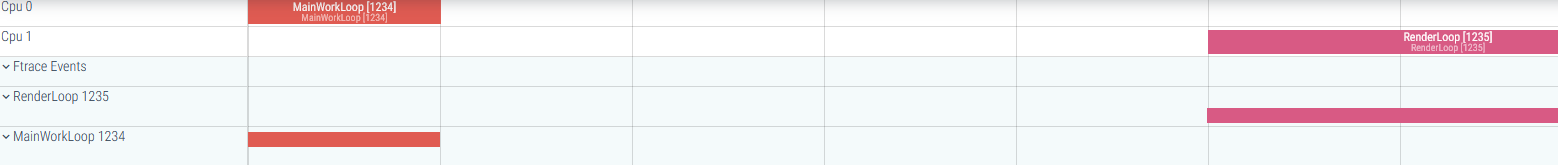
This shows most of the capabilities I’m looking for, though it does have a few oddities:
- Since I’m only using the SchedSwitchFtraceEvent, the thread states between executions are a bit wonky. This might just be a matter of setting the state to the right values.
- For embedded systems, typically there’s only one process. The UI might be a little less cluttered if I treated the RTOS tasks as signle threaded processes for display purposes.
- The track showing the thread’s run state is seperate from the one showing its code execution slice. That’s fine, but it might look a little weird with additional data stacked in it.
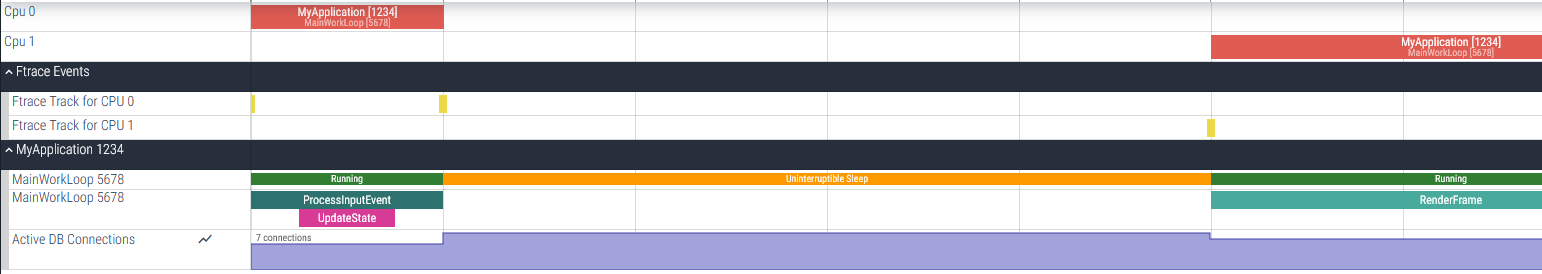
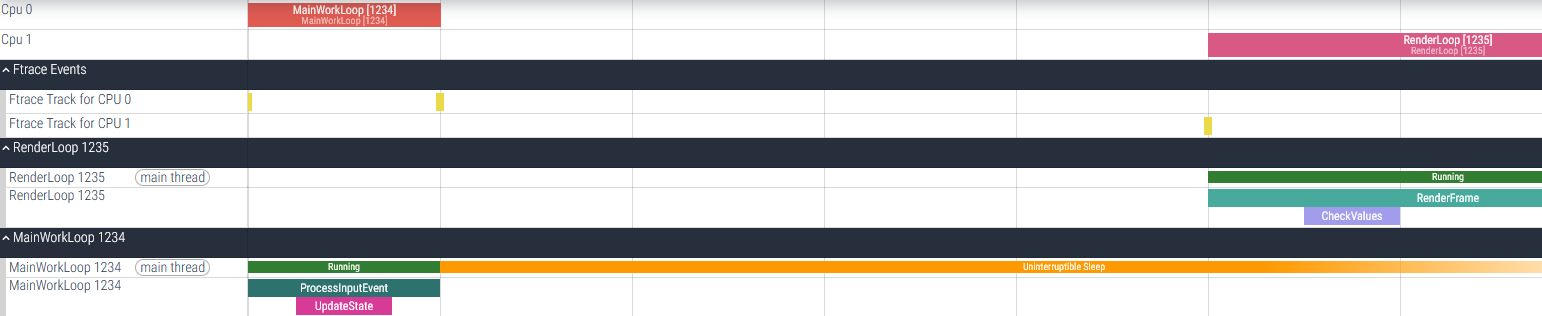
Here’s a second attempt that treats tasks as seperate processes:
1
2
3
4
5
6
7
8
9
10
11
12
13
14
15
16
17
18
19
20
21
22
23
24
25
26
27
28
29
30
31
32
33
34
35
36
37
38
39
40
41
42
43
44
45
46
47
48
49
50
51
52
53
54
55
56
57
58
59
60
61
62
63
64
65
66
67
68
69
70
71
72
73
74
75
76
77
def populate_packets(builder: TraceProtoBuilder):
    TRUSTED_PACKET_SEQUENCE_ID = 8009

    # --- Define OS Process and Thread IDs and Names ---
    MAIN_PROCESS_ID = 1234
    MAIN_PROCESS_NAME = "MainWorkLoop"
    RENDER_PROCESS_ID = 1235
    RENDER_PROCESS_NAME = "RenderLoop"
    # Dummy value
    PRIO = 120

    # --- Define UUIDs for the tracks ---
    # While not strictly necessary to parent a thread track to a process track
    # for the UI to group them by PID, defining a process track can be good practice
    # if you want to name the process explicitly or attach process-scoped tracks later.
    main_track_uuid = uuid.uuid4().int & ((1 << 63) - 1)
    render_track_uuid = uuid.uuid4().int & ((1 << 63) - 1)

    # 1. Define the Process Track (Optional, but good for naming the process)
    packet = builder.add_packet()
    packet.timestamp = 14998
    desc = packet.track_descriptor
    desc.uuid = main_track_uuid
    desc.process.pid = MAIN_PROCESS_ID
    desc.process.process_name = MAIN_PROCESS_NAME

    packet = builder.add_packet()
    packet.timestamp = 14999
    desc = packet.track_descriptor
    desc.uuid = render_track_uuid
    desc.process.pid = RENDER_PROCESS_ID
    desc.process.process_name = RENDER_PROCESS_NAME

    # Helper to add a slice event to a specific track
    def add_slice_event(ts, event_type, event_track_uuid, name=None):
        packet = builder.add_packet()
        packet.timestamp = ts
        packet.track_event.type = event_type
        packet.track_event.track_uuid = event_track_uuid
        if name:
            packet.track_event.name = name
        packet.trusted_packet_sequence_id = TRUSTED_PACKET_SEQUENCE_ID

    # 3. Emit slices on the main_thread_track_uuid
    add_slice_event(ts=15000, event_type=TrackEvent.TYPE_SLICE_BEGIN,
                    event_track_uuid=main_track_uuid, name="ProcessInputEvent")
    # Nested slice
    add_slice_event(ts=15050, event_type=TrackEvent.TYPE_SLICE_BEGIN,
                    event_track_uuid=main_track_uuid, name="UpdateState")
    add_slice_event(ts=15150, event_type=TrackEvent.TYPE_SLICE_END,  # Ends UpdateState
                    event_track_uuid=main_track_uuid)
    add_slice_event(ts=15200, event_type=TrackEvent.TYPE_SLICE_END,  # Ends ProcessInputEvent
                    event_track_uuid=main_track_uuid)

    add_slice_event(ts=16000, event_type=TrackEvent.TYPE_SLICE_BEGIN,
                    event_track_uuid=render_track_uuid, name="RenderFrame")
    add_slice_event(ts=16100, event_type=TrackEvent.TYPE_SLICE_BEGIN,
                    event_track_uuid=render_track_uuid, name="CheckValues")
    add_slice_event(ts=16200, event_type=TrackEvent.TYPE_SLICE_END,  # Ends UpdateState
                    event_track_uuid=render_track_uuid)
    add_slice_event(ts=16500, event_type=TrackEvent.TYPE_SLICE_END,
                    event_track_uuid=render_track_uuid)

    def add_scheduled_period(events, start, stop, name, pid):
        # The state does effect the status the thread is shown as between runs
        events.append(FtraceEvent(timestamp=start, pid=0, sched_switch=SchedSwitchFtraceEvent(
            next_comm=name, next_pid=pid, next_prio=PRIO, prev_comm='swapper', prev_pid=0, prev_prio=PRIO, prev_state=0)))
        events.append(FtraceEvent(timestamp=stop, pid=pid, sched_switch=SchedSwitchFtraceEvent(
            next_comm="swapper", next_pid=0, next_prio=PRIO, prev_comm=name, prev_pid=pid, prev_prio=PRIO, prev_state=2)))

    packet = builder.add_packet()
    packet.ftrace_events.cpu = 0
    add_scheduled_period(packet.ftrace_events.event, 15000, 15200, MAIN_PROCESS_NAME, MAIN_PROCESS_ID)

    packet = builder.add_packet()
    packet.ftrace_events.cpu = 1
    add_scheduled_period(packet.ftrace_events.event, 16000, 16500, RENDER_PROCESS_NAME, RENDER_PROCESS_ID)
And again with the process trees open:
Summary
This is one of those situations where any of these projects would be a fine starting point. At the end of the day, it should be possible to convert my output data format into something that could be fed into any of these tools.
With that in mind I think I’m going to plan on using Perfetto. It is actually made to be able to ingest data fairly flexibly, and even though it’s a bit weird needing to map to ftrace events, its a lot easier then getting the other displays to work. It could even let me use other ftrace analysis tools out of the box.
I’m certainly going to use SEGGER SystemView as a point of reference for my own design, and keep Tracy in mind for future PC based software developement.