
Making an Embedded Profiler 2: Minimal Logging Library
I prototyped an embedded logging library. It focuses on flexibility, low resource usage, and compile-time configurability.
The library can be found at: https://github.com/axlan/min-logger/
This is a follow up to Making an Embedded Profiler 1: Surveying Existing Tracing Tools.
I did the development described here shortly after the original article, but didn’t have a chance to write it up until now.
In that time, another developer reached out to me about https://github.com/RTEdbg/RTEdbg which targets a very similar niche to the code I’ll discuss here. I’ve only had a chance to give it a fairly cursory look through, but it seems like a well thought-out project with a pretty end-to-end implementation for several processors. However, its tooling is Windows only and its build systems are all coupled with IDEs, so getting started would require a fair bit of work to adapt to the project structures I’m interested in.
I called my library “min-logger” and focused on making a prototype that would run in Linux and on a PlatformIO Espressif (the WiFi microcontrollers like the ESP32) build.
Design Priorities
Every now and then I find myself looking for a good embedded logging library. Unfortunately, there are a bunch of trade-offs in both resource usage and moving complexity between different parts of the system. For example:
- The mechanism for getting the log data off the device can be a serial channel. Here you need to potentially contend with dropped data and initial synchronization. These channels are also often bandwidth limited.
- Alternatively, logging may need to be done using a debugging tool like JTAG. This can make things very coupled to the specific processor and debugger (e.g. SEGGER RTT).
- It can use up precious storage space to compile in the strings used for logging.
- The design of bare-metal, RTOS, and POSIX applications are very different, requiring different log handling.
- Often continuous logging is not practical, so logging is only done when a trigger or crash occurs.
- Does the logging need to be low latency? How much memory is available for buffering, and what should happen if a buffer fills up?
- Different applications will want to log different amounts and types of data. Sometimes this requires instrumenting an RTOS or querying info from the kernel if present.
- Different embedded systems have different build tools and compilers, which may limit the standard libraries that can be used.
- To minimize resources on the device, context can be kept on the host collecting the log. This can make the host tools more complicated and require pre-build steps to generate files.
- The code for calling the log function can be more permissive, or be more explicit and generate compile-time errors if it’s used incorrectly.
- Ideally it should be easy to use. Making the logging calls should be simple.
So having a universal logging library is a bit of a pipe dream. Even if a single library did address all the use cases and trade-offs, it would be overwhelmingly complicated. There may be a way to thread that needle, but for now there are lots of small projects in this space that do an OK job at some of these priorities.
So with this in mind, I decided to write my own library that hits the balance that I personally wanted.
Theory and High Level Design
What a Logger Captures
I’ve been particularly interested in making a logging library that didn’t need to send any static strings. For a log message like LOG_ERROR("CRITICAL ERROR"), there’s no information that needs to be conveyed except that the particular error occurred. The severity (‘LOG_ERROR’) and the string message can be inferred by just tracking which log call was triggered.
This means that for a most minimal logging library that could only send static messages like this, the only thing that needs to be logged is an ID that maps to this unique log statement in the code. The host would then have a map of IDs back to their original context and could generate text or other data files with all the details like severity, source file+line, and a string message. This would be limited to very basic logging though.
There are two main kinds of dynamic data that are usually added as part of a log. First, there are the values captured explicitly like: LOG_INFO("temp: %d", temp_val). This example encodes the temperature as a string, though some logs will capture values in more structured ways. The second kind of values are the context that is captured implicitly. For example:
1
2
3
4
5
6
7
8
import logging

logging.basicConfig(
    format="%(name)s: %(asctime)s | %(process)d:%(thread)d >>> %(message)s",
    datefmt="%Y-%m-%dT%H:%M:%SZ",
)

logging.error("unexpected error")
captures the logger name, timestamp, process ID, and thread ID:
1
root: 2023-02-05T14:11:56Z | 428223:128418208166016 >>> unexpected error
Whether the values are captured explicitly or implicitly, I’d at least want a design that has the capacity for capturing dynamic values.
Dividing Up the Design
I’m at the point in my software development journey where it’s hard for me not to overengineer a greenfield project like this. To try to combat this, I like making things modular. It’s still a form of overengineering, but at least it lets me focus on the parts of a project I’m interested in. I can rationalize doing a basic job on the rest with the thought that I could always swap those sections for something better down the line.
I divided up the logging library into the following parts:
- Log specification - Any extra information that needs to be defined for the logging to work. For example, data to map enumeration values to log strings or logged data descriptions.
- The logging calls - The way that the user code interacts with the library. It needs to be able to pass an ID and values to be logged.
- Context generation - This layer adds values for implicit context like thread ID or timestamps.
- Serialization - This layer generates the message in memory to send.
- Transport - This layer sends out the data to the host.
- Host capture - This tool logs the data coming from the device.
- Data analysis - These are tools that can process the logs and generate visualization or other artifacts.
I’m primarily focused on layers 2. and 6.. I want to make the logging calls as polished as I can, and I want to be able to use the profiling visualization tool from Making an Embedded Profiler 1: Surveying Existing Tracing Tools.
I’m a bit less interested in 2-4 since these steps tend to be the most platform specific.
To make the design modular, I need to think through what information passes from one step to the next.
Log Specification
The log specification can potentially get the following details from a log ID:
- The source file and line the log statement is on
- The severity of the log statement
- The expected payload size and structure
- A string description
- Log filter tags. For example, all the logs involved with request handling could have a “requests” tag that could be used for host-side filtering
- A format string that references the included payload, or other information (e.g. “Error duration too long. [previous:%u, current:%u]”)
- Special handling. For instance, certain log IDs could be reserved for capturing profiling data that would be processed differently from “generic” values
- A relationship with other log messages. For example, two logs that captured timestamps could be matched up to compute the delay between them. This is useful for profiling execution times
This information could be its own file, but it could also be inferred from the logging calls implicitly. For example I could use a C parser to find the log calls and record their source location.
Logging Call Design
I want adding log statements to be very low friction, so I want to minimize the boilerplate needed. The logging call could be as simple as:
1
void log(IDType id, void* data, size_t data_len)
This requires making a concrete choice about the size of the ID. I’ll discuss that a bit later so for now we’ll treat it as its own integer type.
There are a few reasons to make the logging call a bit more complex. First, I initially wanted to make this logging library capable of swapping between minimized binary and full string output. This would be a compile-time macro that would do something like the following:
1
2
3
4
5
6
7
#define LOG_ID(id, level, msg, payload_type, payload, size)                              \
    if (!DISABLE_VERBOSE_LOGGING && is_verbose()) {                                      \
        log_verbose(id, __FILE__, __LINE__, __func__, msg, level, payload_type, payload, \
                    size);                                                               \
    } else {                                                                             \
        log_binary(id, payload, size);                                                   \
    }
Separately, I also didn’t like that the ID needed to be manually specified. The user would need to keep track of the values used. I wanted to see if I could figure out a way to generate the IDs at compile time.
Context Generation
The context I’m most interested in is a timestamp and thread/task ID.
I didn’t want to spend a ton of time engineering this process so I mostly just made simple solutions for Linux and Espressif.
The main design point I needed to decide was how to log this additional data. To a certain extent this is tied up with the serialization. For example, to minimize bandwidth, the timestamps could be a relative time. If absolute time was needed, a periodic mapping message could be sent.
Similarly, if I wanted to map log messages to named threads, I could publish this mapping periodically or send it with every message. These approaches would be less viable in a system where messages might be frequently dropped.
Capturing this context or sending out periodic messages brings in the potential for processing delays, additional threads, and inter-thread synchronization. The design for a single-core system would be vastly different from one that’s multi-cored.
Serialization / Transport
On the serialization side, there’s tons of design space. In some systems you’d need to work with an existing message framing protocol. Some interfaces are lossy, and some don’t have that concern (UART vs TCP). I make some basic choices for my implementation, but it should be easy enough to swap out for other platforms.
The main thing to figure out is the layer between the serialization and the transport. Ideally, logging should not block on the data waiting to be sent out to the host. In my examples I used existing transport buffers. On a bare-metal system this might be best accomplished by using a ring buffer and setting up DMA.
Host Capture
Host capture can be surprisingly complicated to implement robustly. Some systems have tiny buffers for serial data by default that can silently drop data, and it can be hard to minimize latency if that’s a priority. However, here I’m doing the minimum to dump data to files.
Data Analysis
The most basic design for analysis would be to combine the information from the log specification to the data captured from the host and converting it into a machine-readable format (CSV, JSON, binary structs, etc.). It could involve syncing the data and error correcting, and propagating any persistent state between messages.
For special message types like profiling, visualizations could be built in.
My Implementation
Based on my skill set, I wanted to make a C/C++ library that used Python for any pre-build processing and for analysis. I ended up going through a few iterations as I got far enough to realize that there was a simpler option.
Throughout, I used CMake to manage the Linux build with test examples.
Attempt 1: Generating Helper Functions
My first instinct was to use Python to generate C code that would capture the context for logging with strings. The advantage to generating the code this way was that in code, the log functions could be identified with a string (e.g. “example_temp_error”). The Python code could then turn all the values into numeric IDs that fit in the smallest number of bytes and include these IDs in the generated files.
The code can be found here: https://github.com/axlan/min-logger/tree/gen-helper-file
The CMake would run a pre-build Python command https://github.com/axlan/min-logger/blob/gen-helper-file/cmake/BuildLogger.cmake to generate _min_logger_gen.h
The user would use the MIN_LOGGER_LOG function:
1
2
3
4
#define MIN_LOGGER_LOG(level, msg, id) \
    if (MIN_LOGGER_MIN_LEVEL >= level) { \
        min_logger_log_func_##id(); \
    }
which would then call the generated code. For example MIN_LOGGER_LOG(MIN_LOGGER_INFO, "hello world", 0); would generate:
1
2
3
4
5
6
7
8
9
10
11
12
13
14
15
16
static inline void min_logger_log_func_0(){
    if (*min_logging_is_verbose()){
#if !MIN_LOGGER_DISABLE_VERBOSE_LOGGING
        min_logger_format_and_write_log(MIN_LOGGER_NO_TAGS,
                                        "examples/hello_cpp/hello.cpp",
                                        4,
                                        "hello world",
                                        20);
#else
    min_logger_write_msg_from_id("0", "", 0);
#endif
    }
    else {
        min_logger_write_msg_from_id("0", "", 0);
    }
}
I realized as I went to add additional logging functions that it was becoming quite complex to generate all this C code in Python. Naming the log statements actually seemed like more work than giving them a numeric value, so I decided to refactor to drop the whole code generation approach.
Attempt 2: Generating ID from CRC of Source Location
The code for this version can be found here: https://github.com/axlan/min-logger/tree/verbose-logging
I had spent a lot of time brainstorming how to generate a unique ID on the device side that would be possible to determine for the host as well. There are a few macros that are often used for this sort of purpose:
__LINE__- The line number of the source file the macro expands on. This will have collisions if log statements occur on the same line in different files.__COUNTER__- Not part of the C standard, but supported by most compilers. Each time it’s used, it expands to an integer literal one greater than its previous expansion. This would be difficult to predict the value from Python, and could have collisions for code with multiple compilation units.__FILE__ + __LINE__- This would be fairly reliably unique, but there’s no simple compile-time method to convert this to an integer.
I am probably overly fond of C++ metaprogramming, and had been contemplating using recursive templating to hash the file+line number at compile time. When I decided to commit to using integers as an ID, I decided to actually implement this approach: https://github.com/axlan/min-logger/blob/master/src/min_logger/min_logger_crc.h
I didn’t want to drop C support, so I made a runtime implementation as well, but it had a few disadvantages.
- The code to do the computation uses a lookup table which takes up RAM.
- The code needs to run the first time a log is called, adding to the CPU usage.
- The logic for caching the ID adds to the complexity of the logging calls.
- The strings for the file+line need to be compiled into the program, making it larger.
To avoid these disadvantages, I left the option to explicitly specify the ID. This would also have a use in the C++ code to avoid having an ID change if the code was refactored and a log statement’s source location changed. If the IDs are hard-coded, old logs could be reprocessed without needing to archive or regenerate the log specification associated with that build.
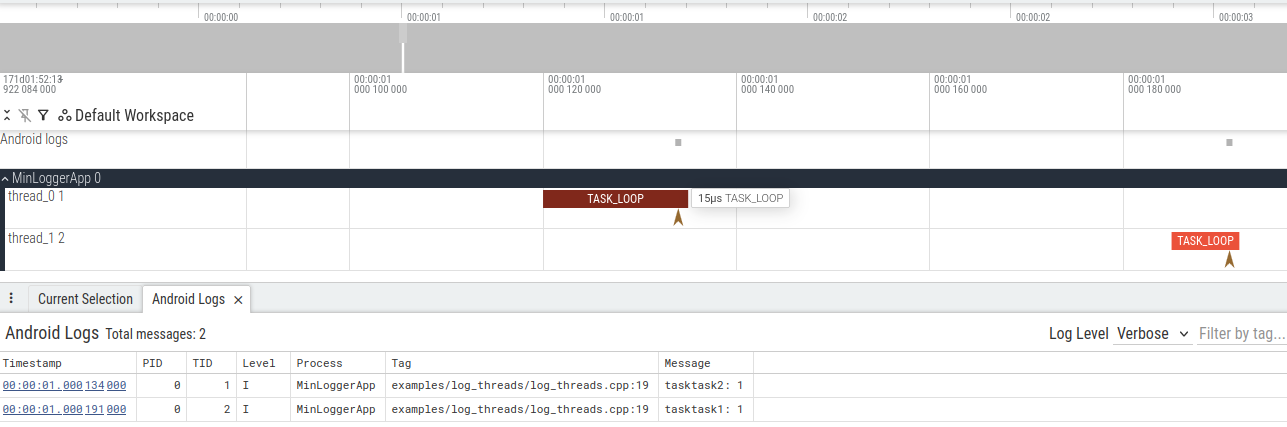
With this approach I finished off the basic features, and was able to get the end-to-end demo I was looking for. https://github.com/axlan/min-logger/blob/master/examples/log_threads/log_threads.cpp could be visualized as:
This version of the library uses a somewhat convoluted system for associating dynamic values with log messages. This has the disadvantage that the overhead of sending a log message needs to be duplicated for each value, but the values can be used by multiple different log statements. Variables are logged in their own log calls, and subsequent log messages can reference them:
1
2
3
MIN_LOGGER_RECORD_STRING(MIN_LOGGER_INFO, "T_NAME", msg.c_str());
MIN_LOGGER_RECORD_VALUE(MIN_LOGGER_INFO, "LOOP_COUNT", MIN_LOGGER_PAYLOAD_U64, i);
MIN_LOGGER_LOG(MIN_LOGGER_INFO, "task${T_NAME}: ${LOOP_COUNT}");
The analyzed logs would be printed as:
1
2
3
4
5
6
7
8
9
10
14780722.900970 INFO  examples/log_threads/log_threads.cpp:19 thread_id_1] tasktask2: 0
14780722.900990 INFO  examples/log_threads/log_threads.cpp:19 thread_id_0] tasktask2: 0
14780723.901040 INFO  examples/log_threads/log_threads.cpp:19 thread_id_1] tasktask2: 1
14780723.901062 INFO  examples/log_threads/log_threads.cpp:19 thread_id_0] tasktask1: 1
14780724.901795 INFO  examples/log_threads/log_threads.cpp:19 thread_id_0] tasktask2: 2
14780724.901811 INFO  examples/log_threads/log_threads.cpp:19 thread_id_1] tasktask2: 2
14780725.902618 INFO  examples/log_threads/log_threads.cpp:19 thread_id_1] tasktask2: 3
14780725.902661 INFO  examples/log_threads/log_threads.cpp:19 thread_id_0] tasktask2: 3
14780726.903073 INFO  examples/log_threads/log_threads.cpp:19 thread_id_0] tasktask2: 4
14780726.903142 INFO  examples/log_threads/log_threads.cpp:19 thread_id_1] tasktask2: 4
This shows a bug/feature where the variables associated with the log lines aren’t thread specific. You can see that the name for the second thread would sometimes be interleaved with the log line from the first thread. This would be trivial to fix if I made the values thread specific, but the preferred behavior is situational. Ideally, I’d want to be able to specify the behavior as part of the format string.
Attempt 3: Dropping Verbose Logging to Streamline Logging Payloads
The code for this version can be found here: https://github.com/axlan/min-logger/ (I finally spent the time to mostly clean up the documentation)
A lot of the complexity and limitations in the code base were due to wanting to be able to switch between ASCII and binary logs at runtime.
I had decided to support this feature since it made debugging easier, and it was nice to have a mode to get human-readable output directly. However, I decided that improving and documenting the library would be easier going forward if I simplified it to focus on the efficient binary output.
This let me make the interface for logging arbitrary values much more robust:
/**
 * Log a single fixed-size value (C++ only, auto-generates ID).
 *
 * The message ID is automatically generated from __FILE__ and __LINE__.
 *
 * Compile-time constraints:
 * - level must be an integer or priority constant
 * - name should contain only variable-name-valid characters
 * - type must match the actual type of value. If it is not a primitive type, it must be
 *   described in a type_defs JSON file when generating the mapping. The type must be a
 *   plain old data (POD) type with no pointers or references.
 * - value must be a variable that can be pointed to
 *
 * Runtime behavior:
 * - Serializes the value if level checks pass
 *
 * @param level The log level (MIN_LOGGER_DEBUG, MIN_LOGGER_INFO, etc.)
 * @param name  Descriptive name for the value (used in external mapping)
 * @param type  The C++ type of the value (must match actual type)
 * @param value The value to log (type-checked at compile time)
 *
 * Example:
 *   float current_temp = 25.5f;
 *   MIN_LOGGER_RECORD_VALUE(MIN_LOGGER_WARN, "cpu_temp", float, current_temp)
 */
#define MIN_LOGGER_RECORD_VALUE(level, name, type, value)                 \
    {                                                                     \
        PRIVATE_MIN_LOGGER_LOG_MSG_GEN_ID(MIN_LOGGER_LOC);                \
        MIN_LOGGER_RECORD_VALUE_ID(min_log_id, level, name, type, value); \
    }

/**
 * Identical to MIN_LOGGER_RECORD_VALUE at runtime. The difference is that this macro
 * provides context for tools that extract log metadata to generate a message when this
 * value is sent. In the msg, use ${VALUE_NAME} to reference this or previously logged
 * values.
 */
#define MIN_LOGGER_RECORD_AND_LOG_VALUE(level, name, type, value, msg) \
    MIN_LOGGER_RECORD_VALUE(level, name, type, value)
Now arbitrary data types can be logged, and if a log message should be printed each time a value is sent, this can be done with a single logging call. I also added the capability to save the recorded values to *.csv files.
I supported this by making a quick and dirty JSON data type description format. This file is a dictionary of custom or ambiguous types to Python struct format string values. These can reference other definitions in the file or C primitives. Struct formats must be a number of repetitions and a single value character. Custom types can also start with a number of repetitions for fixed-size arrays.
Example:
1
2
3
4
5
6
7
8
9
10
11
12
13
14
15
{
    "int": "i",
    "Point": {
        "x": "f",
        "y": "f",
        "dummy": "2i"
    },
    "Rect": {
        "pos": "Point",
        "size": "Point",
        "padding": "10x",
        "str": "10s",
        "bytes": "10s"
    }
}
See https://github.com/axlan/min-logger/tree/master/examples/custom_type for a full example.
One last feature I added was a tool for cross-checking these type definitions with the structures as defined by the compiler. The easiest way I could think of was using the debugger to print the size of the type:
1
gdb build/examples/custom_type/custom_type -X "print sizeof(Rect)"
I made a Python script to automate this cross-check: https://github.com/axlan/min-logger/tree/master/python/src/min_logger/validate_types.py
Serialization and Transmission Limitations and Improvements
The library has two serialization approaches built in. The default format (MIN_LOGGER_DEFAULT_BINARY_SERIALIZED_FORMAT / BINARY) isn’t optimized for any particular application, but would be reasonably robust to send over a UART interface. The micro format (MIN_LOGGER_MICRO_BINARY_SERIALIZED_FORMAT / MICRO_BINARY) is pretty minimal while still being suitable for multi-threaded execution profiling.
It is trivial to use a different scheme on the device side. However, it would be somewhat complicated to add new formats to the Python parsing tool.
The Python parsing tool is extremely inefficient. The message framing and decoding of any complex values is done naively in the Python code. If I wanted to support parsing large amounts of data, I would probably choose a dedicated compiled framing tool to sync and drop corrupt data. Then I could use a more well-supported deserialization tool like Kaitai.
On the device side, I’ve mostly been relying on directly passing the data to the output with syscalls. This may add significant overhead to the logging calls. It would be fairly trivial to buffer the transmissions before the calls that may block on a separate thread. I plan on setting something like this up when I make a non-trivial use of this library.
Conclusion
This library reached the level of capability I wanted for a real project.
On the other hand, I made a bunch of choices that met my preferences, but might be baffling to anyone looking to use it.
Some notable decisions:
- Using macros (instead of functions) to allow auto-generated enums in C++
- Using Python regexes to scan the C/C++ macros to record the metadata
- Using the
uvtool to orchestrate Python scripts in the glue logic - Focusing on passing the thread ID in the serialization and analysis