
Making an Embedded Profiler 3: ESP IDF Tools
I want to settle on the tooling I’ll use for a large ESP32 project. I gave the raw ESP-IDF Espressif tools (without the Arduino wrapper) a try for the first time and found two additional logging/profiling tools to evaluate.
This is a follow up to:
- Making an Embedded Profiler 1: Surveying Existing Tracing Tools.
- Making an Embedded Profiler 2: Minimal Logging Library.
I’m at the point where I want to actually figure out the workflows and tools to use to continue my work on Making a Turtle Bot 1: Hacking a Mint Cleaner. I had been frustrated by the limited feedback I was getting during development. So this time I wanted to make sure I could:
- Easily dump data for analysis.
- Get a wholistic view of what the system was doing.
- Have useful debugging and logging tools.
Having completed my own https://github.com/axlan/min-logger, my plan A was to make an ESP32 specific design. My high-level plan was to write the logs to a buffer that would be drained by a separate task sending the data over UDP.
As I began to look into the details of making this implementation I stumbled on two additional candidate libraries I wanted to cover. They both seem worth considering for use in my own development process, and also have interesting implementation details.
MabuTrace
https://github.com/mabuware/MabuTrace
Like my initial assessment of profiling tools, this library also decides to capture binary data to convert into Perfetto logs.
This library wraps the functionality in a super easy UI. To use it you:
- Include the MabuTrace library in the build.
- Initialize MabuTrace during application setup.
- Instrument your code with tracing macros.
- When your process runs, it creates an HTTP server and captures data into a ring buffer.
- Going to the webserver lets you dump the ring of logged profiling data into your browser and seamlessly load it in Perfetto.
I initially tried to use their Arduino example in PlatformIO, but found that it used a newer version of the ESP Arduino library than PlatformIO supported. This is something that had been worrying me for a while since Espressif had decided to stop directly supporting PlatformIO. I decided that if I was going to need to use the ESP-IDF interface to test this library, I might as well go all the way and just use it directly without PlatformIO.
Once I got the ESP-IDF toolchain setup (which was surprisingly painful), the https://github.com/mabuware/MabuTrace/tree/master/examples/MabuTraceIdfExample example worked out of the box.
The output was exactly what I was looking for and I may very well decide to use this tool as part of my development.
One thing I was surprised by was the inclusion of the CPU scheduling information. My reading of the Espressif FreeRTOS integration was that while some FreeRTOS features like the idle/tick hooks or the run time stats were accessible, the majority of the https://freertos.org/Documentation/02-Kernel/02-Kernel-features/09-RTOS-trace-feature weren’t available:
- https://docs.espressif.com/projects/esp-idf/en/stable/esp32/api-reference/system/freertos.html#
- https://docs.espressif.com/projects/esp-idf/en/stable/esp32/api-reference/system/freertos_idf.html
In looking at how Mabu achieves this, they have:
mabutrace_hooks.h:
1
2
3
4
5
6
7
8
9
10
11
12
13
void trace_task_switch(unsigned char type);

// This macro is called when a task is about to be switched out.
#define traceTASK_SWITCHED_OUT() \
  do { \
    trace_task_switch(7); \
  } while(0)

// This macro is called when a task has just been switched in.
#define traceTASK_SWITCHED_IN() \
  do { \
    trace_task_switch(6); \
  } while(0)
which are included into the CMake build with:
1
idf_build_set_property(COMPILE_OPTIONS "-include${CMAKE_CURRENT_SOURCE_DIR}/src/mabutrace_hooks.h" APPEND)
The trace_task_switch feeds the data into the profiler https://github.com/mabuware/MabuTrace/blob/master/src/mabutrace.c#L330.
While the IDF build is complicated, it seems that this effectively forces all the files in the build to add this include https://gcc.gnu.org/onlinedocs/gcc/Preprocessor-Options.html#index-include. This sets the macro for the FreeRTOS compilation.
Even if I don’t use this library directly, this seems like a useful (if possibly brittle) way to customize FreeRTOS beyond what’s available as configuration settings.
One thing to note is that this library uses the Perfetto JSON format instead of protobuf. This means that the way they represent the task core affinity is a bit of a hack.
You can see the core affinity is being shown as “process 2”:
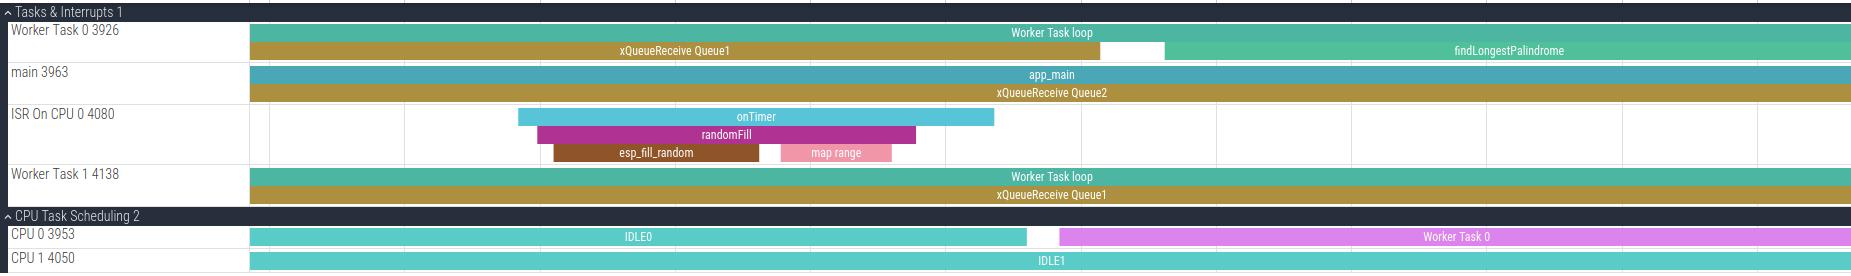
instead of the built-in mechanism that I used in my tests:
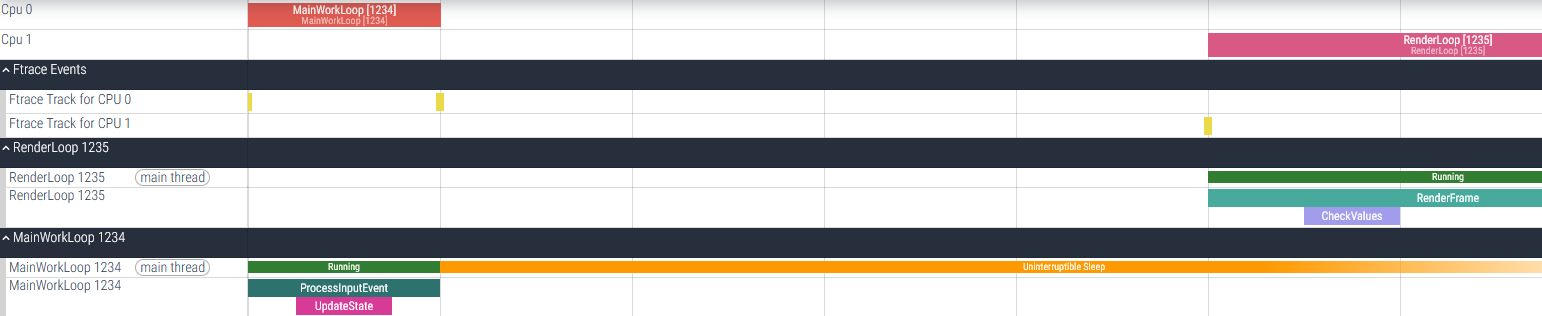
While this isn’t quite as nice as having the cores as their own part of the display, it’s a great workaround for getting most of the way there with the much simpler JSON interface.
ESP-IDF Binary Logging Library
In giving a thorough review of all the libraries and features in the ESP-IDF framework, I was surprised to find https://docs.espressif.com/projects/esp-idf/en/stable/esp32/api-reference/system/log.html#binary-logging. This was surprisingly similar to my https://github.com/axlan/min-logger library.
At a high level, its usage is the same as the design I came up with. The code makes normal logging calls that can either emit text like normal logs or packed binary messages with the strings replaced with integer IDs. On the host side, a special tool is needed to convert the binary back to messages and add back in the missing strings from a local repository.
There are some major differences, though. Functionally, min-logger is much simpler with many fewer features. However, it does out of the box support directly logging values and profiling data, while esp-idf logging is really just about generating formatted log messages.
In terms of implementation, the magic to swap out the strings is very different between the libraries. As explained in min-logger, the strings are captured by a Python script that uses a regex to identify the logging calls and capture the strings. The mapping is made by either manually assigning IDs or through a compile-time CRC of source file locations of the log call.
The ESP-IDF logger uses the following macros:
1
2
3
4
5
6
7
8
9
10
11
12
13
14
15
16
17
18
// https://github.com/espressif/esp-idf/blob/master/components/esp_common/include/esp_attr.h
#define _SECTION_ATTR_IMPL(SECTION, COUNTER) __attribute__((section(SECTION "." _COUNTER_STRINGIFY(COUNTER))))

// https://github.com/espressif/esp-idf/blob/master/components/esp_common/include/esp_attr.h
// Forces data to be removed from the final binary but keeps it in the ELF file
#define NOLOAD_ATTR _SECTION_ATTR_IMPL(".noload_keep_in_elf", __COUNTER__)

// https://github.com/espressif/esp-idf/blob/v5.5.2/components/log/include/esp_private/log_attr.h
// Forces a string to be removed from the final binary but keeps it in the ELF file
#define ESP_LOG_NOLOAD_STR(str) (__extension__({static const NOLOAD_ATTR char __f[] = (str); (const char *)&__f;}))

// https://github.com/espressif/esp-idf/blob/v5.5.2/components/log/include/esp_log_attr.h
#define ESP_LOG_ATTR_STR(str)           (__builtin_constant_p(str) ? ESP_LOG_NOLOAD_STR(str) : str)

// https://github.com/espressif/esp-idf/blob/v5.5.2/components/log/include/esp_log.h#L184
#define ESP_LOG_LEVEL(configs, tag, format, ...) do { \
        esp_log(ESP_LOG_CONFIG_INIT((configs) | ESP_LOG_CONFIGS_DEFAULT), tag, ESP_LOG_ATTR_STR(format) ESP_LOG_ARGS(__VA_ARGS__)); \
    } while(0)
What this does is declare the string as an array stored in a noload_keep_in_elf memory section. The pointer to this array is what is logged in the binary message.
Presumably, one of the build steps strips this section when the ELF is being turned into the binary to send to the device.
The monitor Python tool then recovers these strings from the ELF using the pyelftools library: https://github.com/espressif/esp-idf-monitor/blob/master/esp_idf_monitor/base/binlog.py
This is an interesting approach, and I had considered doing something like this before I came up with the CRC approach. It is probably more robust than my regex approach, but it is more complex and potentially less efficient in needing to store and parse the ELF to interpret the logs.
It’s interesting to see another library that achieved the same goals I was trying for. I might use the approach of putting data in a section that is stripped out for future use cases where I want to capture data from the compiler without adding it to the production binary.