Dashboard to See Dice Stats from Roll20
Unsurprisingly, I am a member of a DnD (Pathfinder actually) group. During the pandemic we switch to playing online with a service called Roll20. We would often joke about the software using weighted dice, so I had the idea to analyze the data and see who’s the unluckiest.
Getting the Roll Data
Roll20 sort of makes it easy to see the entire history of rolls. Every roll is added to the chat log, and you can access the chat archive from a link on the front page of the campaign.
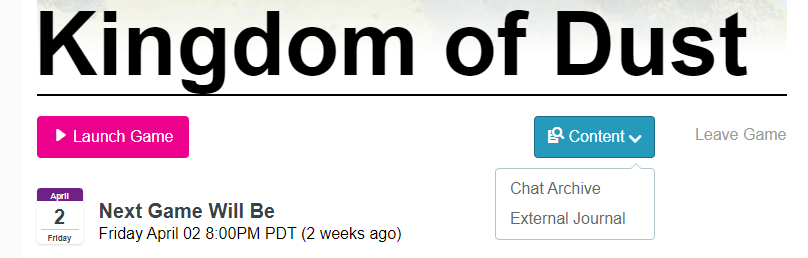
This brings you to an archive page where you can click a “Show on One Page” button to get the entire history loaded.
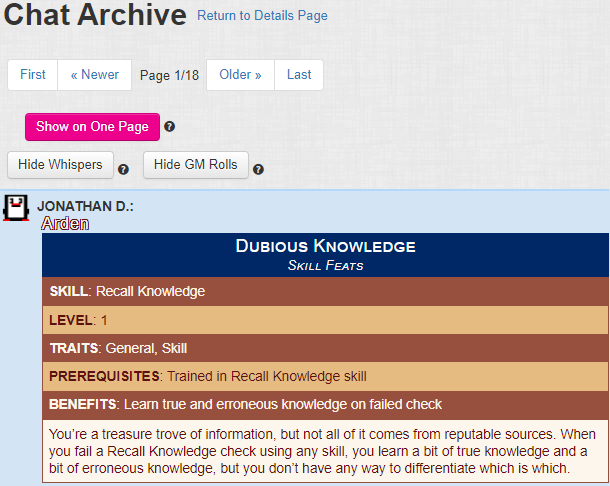
Looking at the source for this page, it’s was looking like it would be pretty hard to get the chat data from a direct web request. My last few projects have ended up with a web scraping component using Selenium, but since I didn’t need to update this data automatically I went with a much easier solution. I just used the Chrome browsers “Save as” right click option. This actually saves the page after it’s loaded all it’s assets through it’s Javascript call backs, so the HTML had all the data ready to parse.
I created a Jupyter notebook https://github.com/axlan/roll20-chatlog-stats/blob/main/parsing_notebook.ipynb to go through the parsing process, since it speeds up trial and error by letting you easily cache the slow processing steps and iterate quickly.
I used BeautifulSoup to parse the HTML, and getting the basic fields was pretty straight forward.
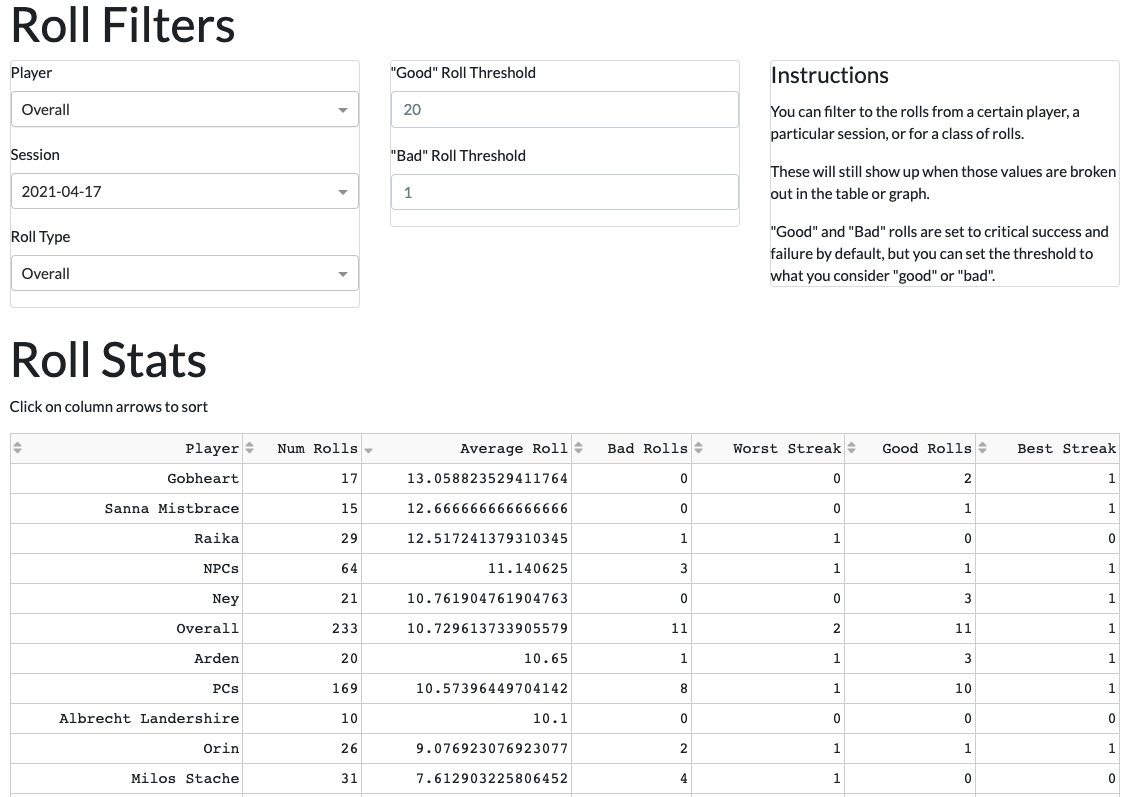
I already knew I wanted to make a dashboard, so I decided to take some extra steps to classify the data. This would it would make it easier to create the fields for filtering and grouping the data:
- The message archive had a lot of results that weren’t rolls, so I filtered down to just the messages with rolls
- To make comparison easier, I further filtered down to just rolls of 20 sided dice
- I took all the different types of rolls (attacks, skills, spells, etc.), and simplified them down into a small set of types
- I grouped the rolls into the game sessions we played
With all this done, I stored the results as a CSV to be loaded by the dashboard.
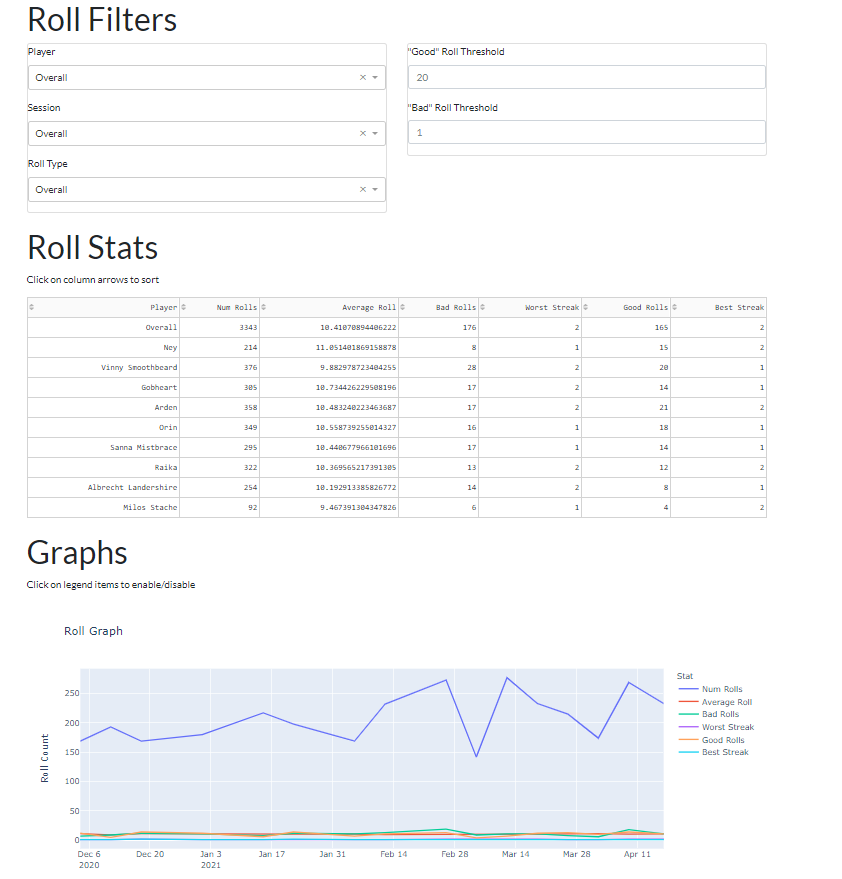
Creating the Dashboard
I’m not much of a fan of web development and I try to do as little direct HTML/CSS/Javascript as possible. This has led me to use Plotly Dash as my go to framework for making interactive data visualizations. It’s a python framework that let’s you specify an HTML layout and the callbacks to update the page as the user changes the fields. It’s made to take advantage of the Plotly graphing framework, and also has some really nice wrappers for tabular data. It took me awhile to really understand how it worked, but now that I got over that hump in the learning curve, I can create a dashboard without much struggle.
https://github.com/axlan/roll20-chatlog-stats/blob/main/dashboard.py
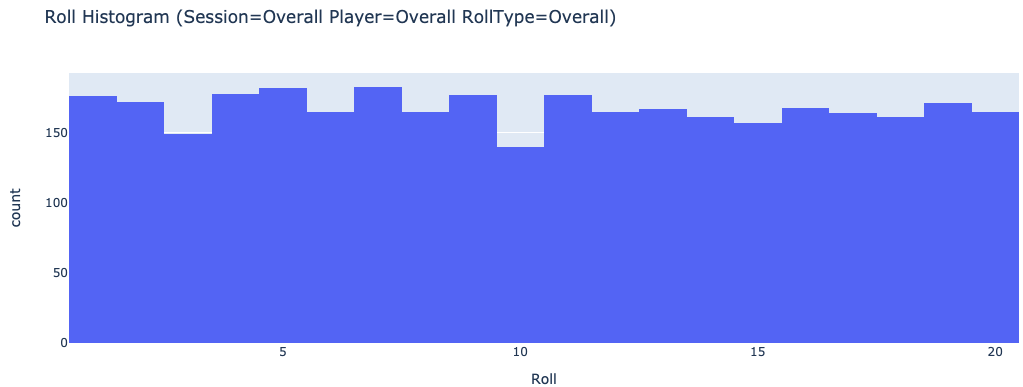
Fun With the Data
Unsurprisingly, the full data set looks fairly random.
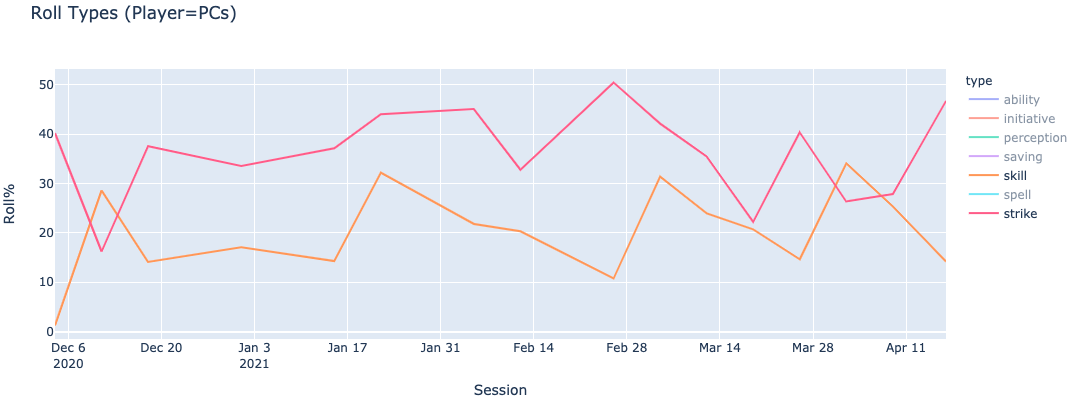
One thing I wanted to look at was how the types of rolls we made changed session to session. My hypothesis was that the more skill checks we did versus attacks (“strikes”), the more we tried to solve the challenges non-violently. The data seemed to back this up based on my memory.
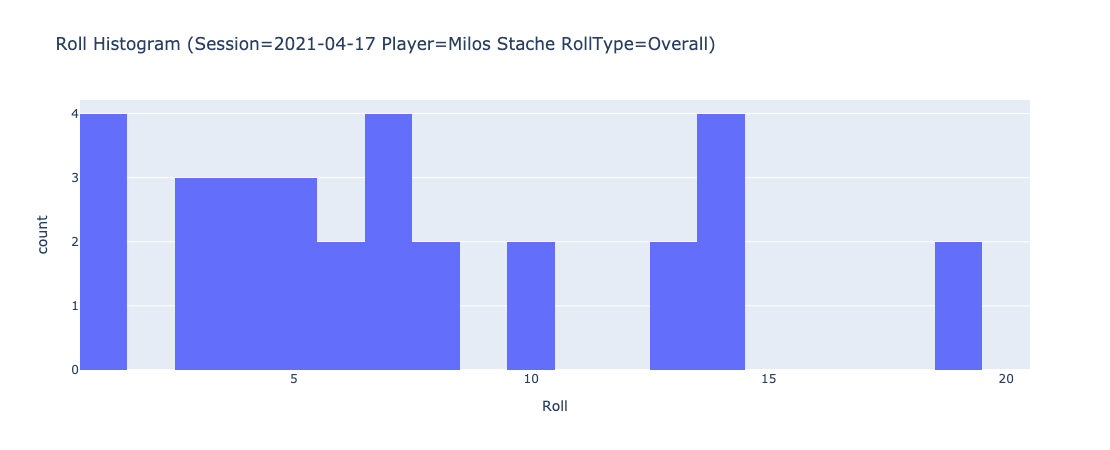
While the overall data is fairly random, you can definitely see how unlucky some people can be for a single session. By sorting the data by “Average Roll” here we can see that Milos had a fairly rough night.