
Adding Wifi to a Weather Station
I bought a cheap weather station with the intent of adding networked data logging. I ended up reverse engineering both the RF transmission, as well as the inter-chip communication at the receiver.
In the end I was able to feed the data to weather underground to use as the frontend.
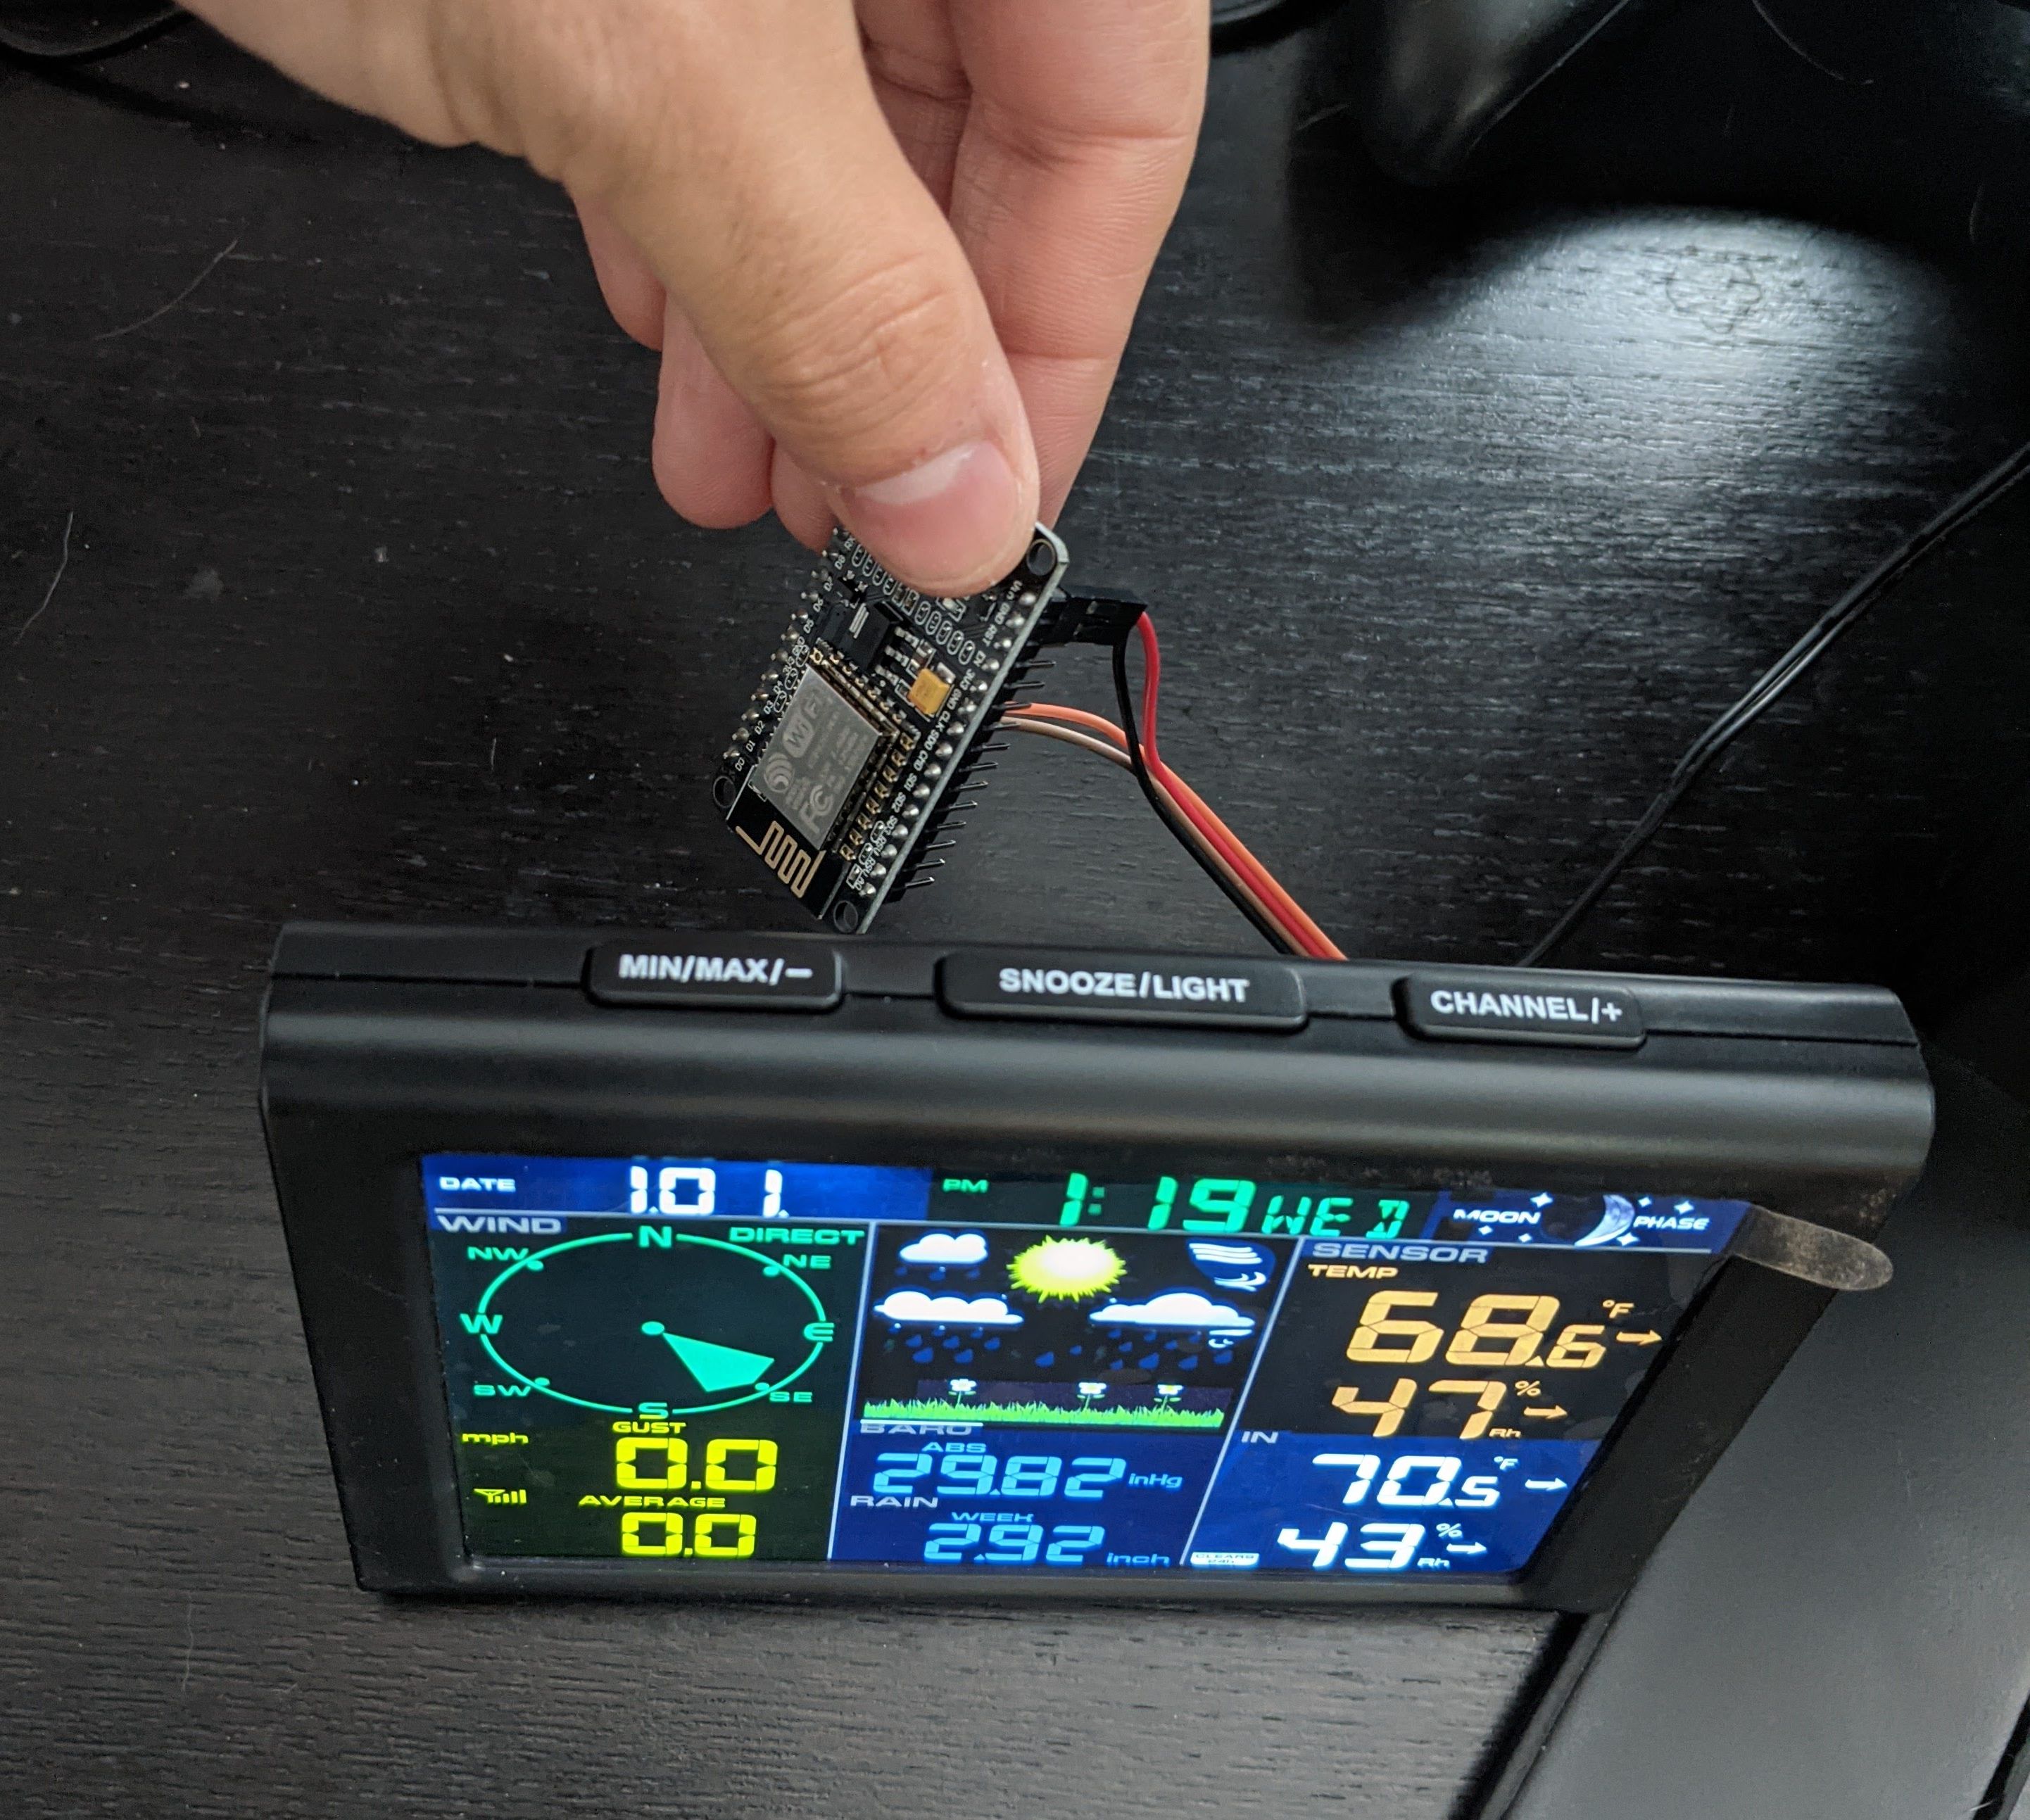
While I kept it nearby during development, here it is at its final destination:
Background
I got a weather station that transmits its measurements over RF to an included display. I figured I’d be able to either directly parse the transmissions, or tap into the data received at the display.
This hack was mostly done to try my hand at RF reverse engineering, rather then to solve a real problem. In fact the manufacturer actually sells a version of this device with the capability I added built in:
The device I bought: https://www.amazon.com/sainlogic-Wireless-Forecast-Temperature-Pressure/dp/B08G1FZZ5M
The wifi enabled varient: https://www.amazon.com/Sainlogic-Professional-Internet-Wireless-Wunderground/dp/B08LL4PXWM
I guess it can be argued I “saved” $40, but as you’ll see, it would be a hard sell based on the cost of labor.
This article is going to assume a basic understanding of digital signal processing. I honestly have forgotten a lot of the more first principle mathematics, so this is coming from an odd perspective of relying on a lot of half remembered intuition.
The other motivation for this project is that I’ve been thinking about setting up a sensor suite for fun to monitor more exotic things like air quality, and gamma radiation. While a lot of things can be measured by throwing a bunch of solid state sensors onto a integration board, basic wind, rain, and temperature actually need some mechanical integration. This was sort of a compromise project to be able to play around with RF, and also install something on my roof.
As a warm up, I tested out the cheap SDR I got by tracking some planes Setting Up GNURadio and Tracking Planes. I’ll be referencing some of the technologies I talk about there, so you can check it out for additional context.
Reverse Engineering the RF
Demodulating the Bits
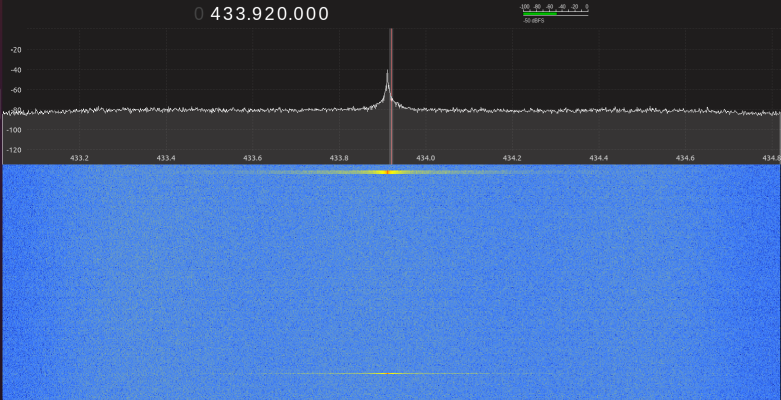
Fortunately, the product listings clearly indicate that the transmit frequency is 433.92MHz. Less fortunately, there isn’t a standard protocol used for this kind of application. Everything from garage doors to RFID readers operate here.
The first task was to look at what was going on in this frequency. Fortunately, it looks like nothing else in my house was transmitting here and I could see clearly see pulses on gqrx that would correspond with updates on the display. These output at about 30 second intervals.
The next task was to capture some of these to a file for analysis. This could be done by using the I/Q recorder tool in gqrx. Since it was easy to know when a sample was coming, I was able to capture short recordings that I knew contained the transmission.
From here I created Jupyter notebooks to let me experiment with the data in Python. You can see the notebooks along with all the other code I’ll be mentioning in https://github.com/axlan/sainlogic-sdr.
The first thing to do was just plot out the time series of the data. Thought the signals are IQ sampled, it turned out that looking at the total magnitude was sufficient to see the sample:
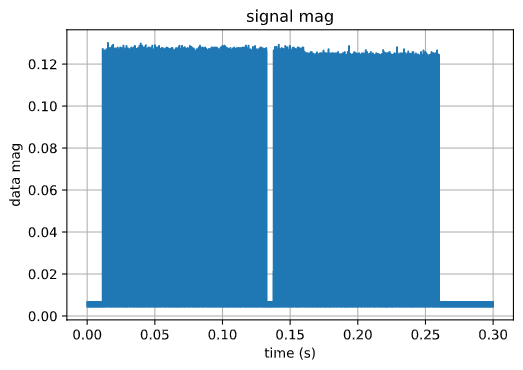
and zoomed in a bit:
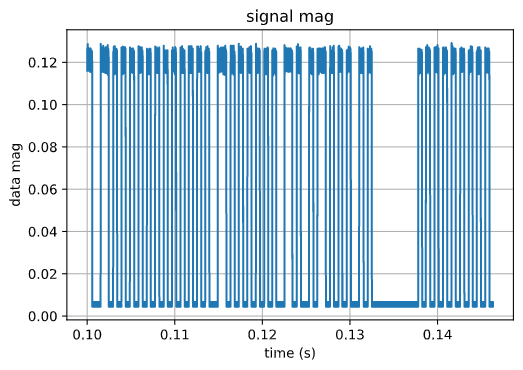
The main thing I noticed here was that the signal is super loud and the bits appear to be encoded as amplitude (as apposed to in phase). The other thing was that that there were only two widths of the pulses. The shortest pulses were about 46.3uS and there would sometime be pulses that were twice as long. Coincidentally, this appeared to be the same modulation scheme that I saw in my warm up project Setting Up GNURadio and Tracking Planes. The data is being transmitted with pulse position modulation (PPM) https://en.wikipedia.org/wiki/Pulse-position_modulation. This is a simple case where a 0 is transmitted as “low, high” and a a 1 is transmitted as “high, low”. This means that 11 is “low, high, low, high” and 10 is “low, high, high, low”.
I realized later that this may have been easier to find existing code for if I instead searched for examples that handled Manchester Encoding which is the same encoding, but focussed on the digital encoding rather then a RF modulation.
Initially, I did some more complicated approaches for being able to decode the bits even if the signal was weak, or there was noise, but most of this seemed to be overkill since the signal was so strong for my use case.
Eventually I switched to a new notebook to try to refine the bit detection to a more streamlined algorithm.
Initially, I was a bit confused since sometimes a transmission burst would include two sequences separated by a short gap. However, as I dug into these, I noticed that they were repetitions. I have no idea why the messages are sometimes duplicated (I eventually found that the weather display transmits something in response to receiving data, so it’s possible there some sort of retransmission request or attempt to avoid colliding with other sensors).
As I continued to look at the data, I noticed that the duration of the pulses was fairly inconsistent. I’m not sure if there’s just a really bad clock, or the output is biased by how long each bit takes to process, but it somewhat complicated the processing to not know exactly how long each bit is supposed to last. This made me decide to focus on decoding the signals by taking advantage of the fact that there would be a transition between high and low at each bit. That way as long as the symbols were between a maximum and minimum length, I wouldn’t desynchronize even if they weren’t consistent lengths.
With all this figured out I now had a set of 128 bits that I needed to find meaning for.
It was at about this point that I learned about the Univeral Radio Hacker project and gave it a shot. It puts a lot of the tools and processing I’m doing together in a no-programming needed GUI. However, in practice I found it wasn’t a great fit for interpreting this signal. I could kind of get it to decode the bits, but it seemed like it had issues with the inconsistent bit length. It would have been nice to use it for tracking the interpretations of the bits and the differences between messages, but I ended up continuing to do this in Python.
Another tool I only found out afterwards is http://triq.net/bitbench which tries to simplify turning the binary messages into parsed values. Similar to URH, it streamlines the process, but for this example it hit issues with some of the values being stored in non-contiguous bytes.
Decoding the Data
Now that I had a series of bits, I needed to find out how to translate them to the sensor measurements.
Since I could manipulate the sensor (spin the wind gauge, put it in the freezer, etc.) and see the results on the display this seemed like it would be an easy task.
Since the message length was a multiple of 128 it was natural to assume the data might be byte aligned. When I compared the values on the display to the bytes in the message, I did indeed find the humidity value encoded as an 8bit integer. The manual gave ranges and resolutions for each measurement, which helped me infer the native units, and the number of bits they’d probably take up. Here’s the list of relevant measurements, along with some guesses for additional fields:
| Measurement | Range | Resolution | Min #Bits |
|---|---|---|---|
| Temp | -40-140F | .1 | 11 |
| Humidity | 10-99% | 1 | 7 |
| Rain | 0-396in | >39.4 .012 else .04 | 14 |
| Wind Dir | 0-360deg | 1 | 9 |
| Wind Speed Gust/Avr | 0-112mph | .1 | 11 |
| Battery | ? | ? | ? |
| Brightness | ? | ? | ? |
| Preamble | ? | ? | ? |
| ID / Header | ? | ? | ? |
| Check Sum | ? | ? | ? |
So something like this will need to fit in 16 bytes. If I only include the documented measurements, and pad each one to a full number of bytes this would be at 11 bytes, which is certainly possible.
When I looked at the bytes that were output over time I was able to notice the following features.
- The first two bytes are always the same.
- The integer in byte 11 matched the humidity on the display
- The 12-14th bytes always seemed to stay the same.
- The last byte would never change on it’s own, but if the message changed by even one other bit, it would change to a “random” value. This indicated it was probably a checksum.
UPDATE: Months after I finished this project I got a GitHub issue with more of the message decoded: https://github.com/axlan/sainlogic-sdr/issues/2
Figuring Out the CRC
Pretty much any message that goes through a noisy channel like RF is going to have some sort of error check included to help reject corrupted data. Cyclic redundancy check (CRC) is one of the most common methods that I would expect to find. Figuring out the CRC would be a huge help for the project since it would confirm that the I’m interpreting the bits correctly and I was capturing the whole message. Also, when I implement my logging application it would let me confirm things were working correctly.
I’ve never tried to reverse engineer a CRC before, but I knew that it should theoretically not be too hard. Googling brought me to a stack exchange which mentioned a tool called RevEng.
This tool is well documented, but it was a little overwhelming to get started with. It provides two main pieces of functionality:
- It can calculate the CRC for a message based on a set of parameters
- Based on a set of messages and CRCs, it can guess the parameters that were used to generate the CRCs
All I had to do was pass in a set of messages as a hex values, and specify that the CRC was 8 bits long. The hex strings are the 15 message plus the 1 suspected CRC byte at the end:
1
2
3
4
$ ./reveng -w 8 -s ffd4c5e000009b0012846e32fffbfb3c ffd4c5e000009a0012846e32fffbfb89
reveng: warning: you have only given 2 samples
reveng: warning: to reduce false positives, give 4 or more samples
width=8  poly=0x31  init=0xff  refin=false  refout=false  xorout=0x00  check=0xf7  residue=0x00  name="CRC-8/NRSC-5"
Not only did this find the parameters, but it also identifies the checksum by name. I could confirm that this worked by then generating the checksum for a new message:
1
2
$ ./reveng -m CRC-8/NRSC-5 -c ffd4cf240000420000846233fffbfb
ae
The site even had a database of all the known CRC implementations, including this one: https://reveng.sourceforge.io/crc-catalogue/1-15.htm#crc.cat.crc-8-nrsc-5. This gave me some super simple c code I could use to implement my own CRC check. Unfortunately, the protocol associated with it seems unrelated to the rest of the message.
This was a real “Aha!” moment since I was super surprised this all worked on the first try. There were lots of things that could have made this not work even if the general idea was sound.
Creating a GNURadio Block
See Setting Up GNURadio and Tracking Planes for more background on GNURadio.
To get the SDR to run in realtime I created a GNURadio project in https://github.com/axlan/sainlogic-sdr/tree/main/gr-sainlogic
I mostly followed the guide in https://wiki.gnuradio.org/index.php/OutOfTreeModules to use the gr_modtool
1
2
3
pybombs run gr_modtool newmod sainlogic
cd gr-sainlogic
pybombs gr_modtool add -t sync -l python sainlogic_decode
Then I needed to edit
- python/sainlogic_decode.py - add the rf processing logic
- python/sainlogic_parser.py - add the shared byte parsing functions
- python/CMakeLists.txt - add sainlogic_parser.py to the build
- grc/sainlogic_sainlogic_decode.block.yml -specify the interfaces
Then I built the project with:
1
2
3
4
mkdir build
cd build
cmake -DCMAKE_INSTALL_PREFIX=~/gnuradio ../
make install
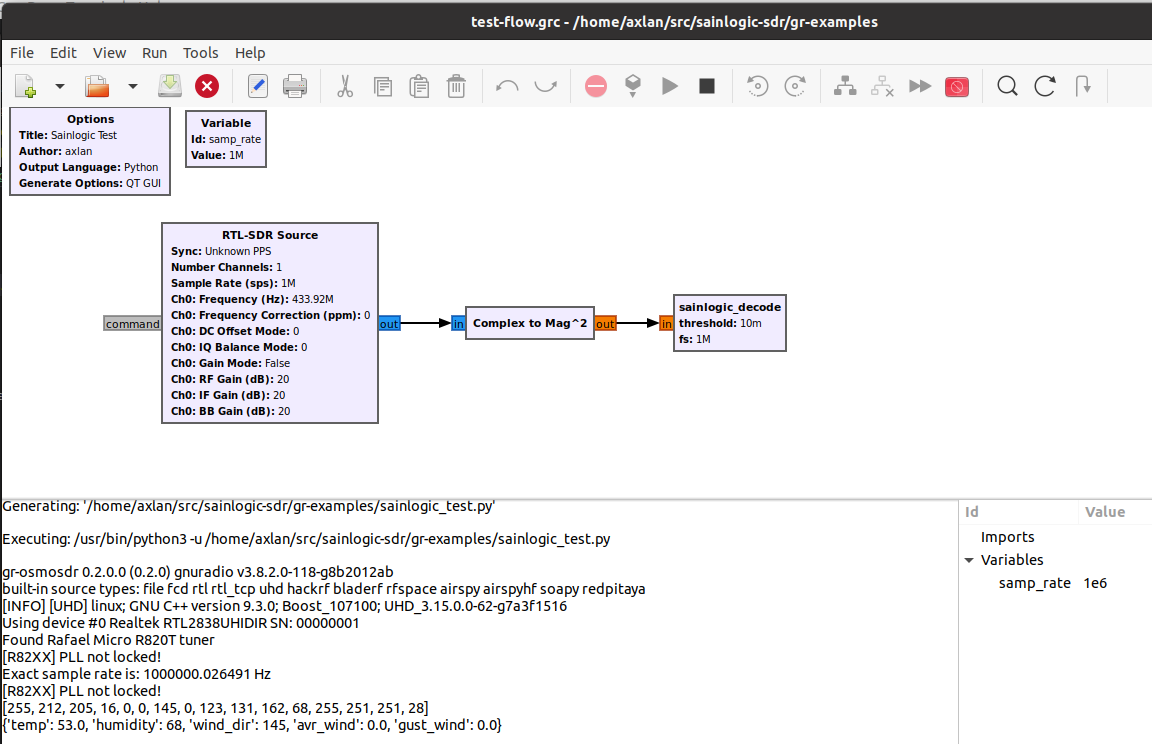
I could then run pybombs run gnuradio-companion examples/test-flow.grc to see the example gnuradio-companion project. Alternatively, source ~/gnuradio/setup_env.sh && python3 examples/top_block_headless.py runs the block directly without the companion or the GUI.
I didn’t make my block particularly well suited to run in the GNURadio environment. I could have broken up the demodulation and decoding using tags. This would allow for easier integration of other analysis tools. However, this is mostly just a proof of concept, I don’t expect it will need to be robustly extended by others in the GNURadio eco system. The project https://github.com/mhostetter/gr-adsb is a good example of how I could break up the processing block.
Figuring Out the Rest of the Fields
Now that I was confident in the packet structure, I focussed on figuring out how to get the known measurements out of the remaining bits. I created the spreadsheet https://docs.google.com/spreadsheets/d/1Xk3j9qIvUZaKT6Lta5JsjCaWRQONkgJZ82Mwz8hHxfk/edit?usp=sharing to do this computation.
Temperature
It was pretty obvious that byte 10 was part of the temperature measurement, since a change in 1 here corresponded to a change of .1 in the display. I needed to get the temperature to change by 10’s of degrees so I could see how the more significant part of the temperature was represented. Fortunately, I could just stick it in the freezer. This showed that it appeared to use the lower 3 bits of bit 10. This ends up giving the formula: temp deg F = float((msg[9] & 0b111) * 256 + msg[10]) * 0.1 - 40.0. This makes some sense since both parts at zero would correspond to the min value of -40deg F.
Wind Direction
This was a little weird. I was clear that byte 5 related to wind direction. However, the value seemed to overflow as the direction changed without an obvious place for the more significant bit. Eventually I realized the byte 5 was the direction in degrees from 0-360 with 0 being North, and 90 being East. The weird part was that the most significant bit was located in the third bit of the 3rd byte. Not sure why it was stored separately, it’s not like being >255 degrees has any special significance.
Rain
The general idea here seems pretty straightforward. As rain fills up a vessel on the sensor, it empties triggering a count. I could just put the sensor in the sink to test this out. This count appears to have two bytes dedicated to it. The display keeps track of the count over time to give how much rain occurred in various time intervals. You can reset the count and it just subtracts off the starting count. The main weirdness is why the manual gave varying accuracy depending on the rain fall. Since the resolution didn’t really line up with the value changes, and the accuracy threshold didn’t really match a bit overflow, I guessed the actual unit being encoded was probably not inches. Sure enough 39.4in is about 1 meter. This let me figure out rain mm = float(msg[7]*256 + msg[8])*0.1. I’m not sure why the resolution would change after 1 meter. It seems like the display is doing a bunch of book keeping, so it might be related to that. It’s also possible that not all of the seventh byte is used for rain fall.
Kind of weird the base units are a mix of metric and imperial…
Wind Speed
This turned out to be pretty similar to the Rain gage. Looking at how the bits related to the display, it seemed like mph wasn’t the “native” unit. Messing around a bit showed that it was actually m/s. Also the average and the gust speeds had the same representation each taking one byte. speed m/s = float(msg[4] or msg[5]) * .1 . This seems to suggest the manual’s range and resolution are not correct. If the range is correct it suggests there might be a more significant bit somewhere. Hopefully, it will never come up.
Unknown Bits
With all the obvious data decoded there was still plenty of data unaccounted for. I’ll need to do longer term tracking, but here’s the breakdown:
1
[0xFF][0xDF][value set on sensor boot?][??+wind_dir][wind_avr][wind_gust][wind_dir][rain][rain][??+temp][temp][humidity][0xFF][0xFB][0xFB][crc]
hex is given where the values appear constant.
I know that the sensor can report low battery, so I expect that is encoded in one of the unknown regions, or perhaps one of the constant appearing sections. I’d also suspect that the solar value is covered somewhere.
With the protocol effectively reverse engineered I knew I could receive the data wirelessly using the SDR. The problem is that having a computer with an SDR dedicated to logging temperature seemed like overkill. Since I had the receiver it came with, it seemed like it would be more efficient to just tap into the inter-chip communication and publish that.
Reverse Engineering the Inter-chip Communication
I probably did a bit less thorough job here after spending so much time on the RF side, but it was interesting to finally open this up.
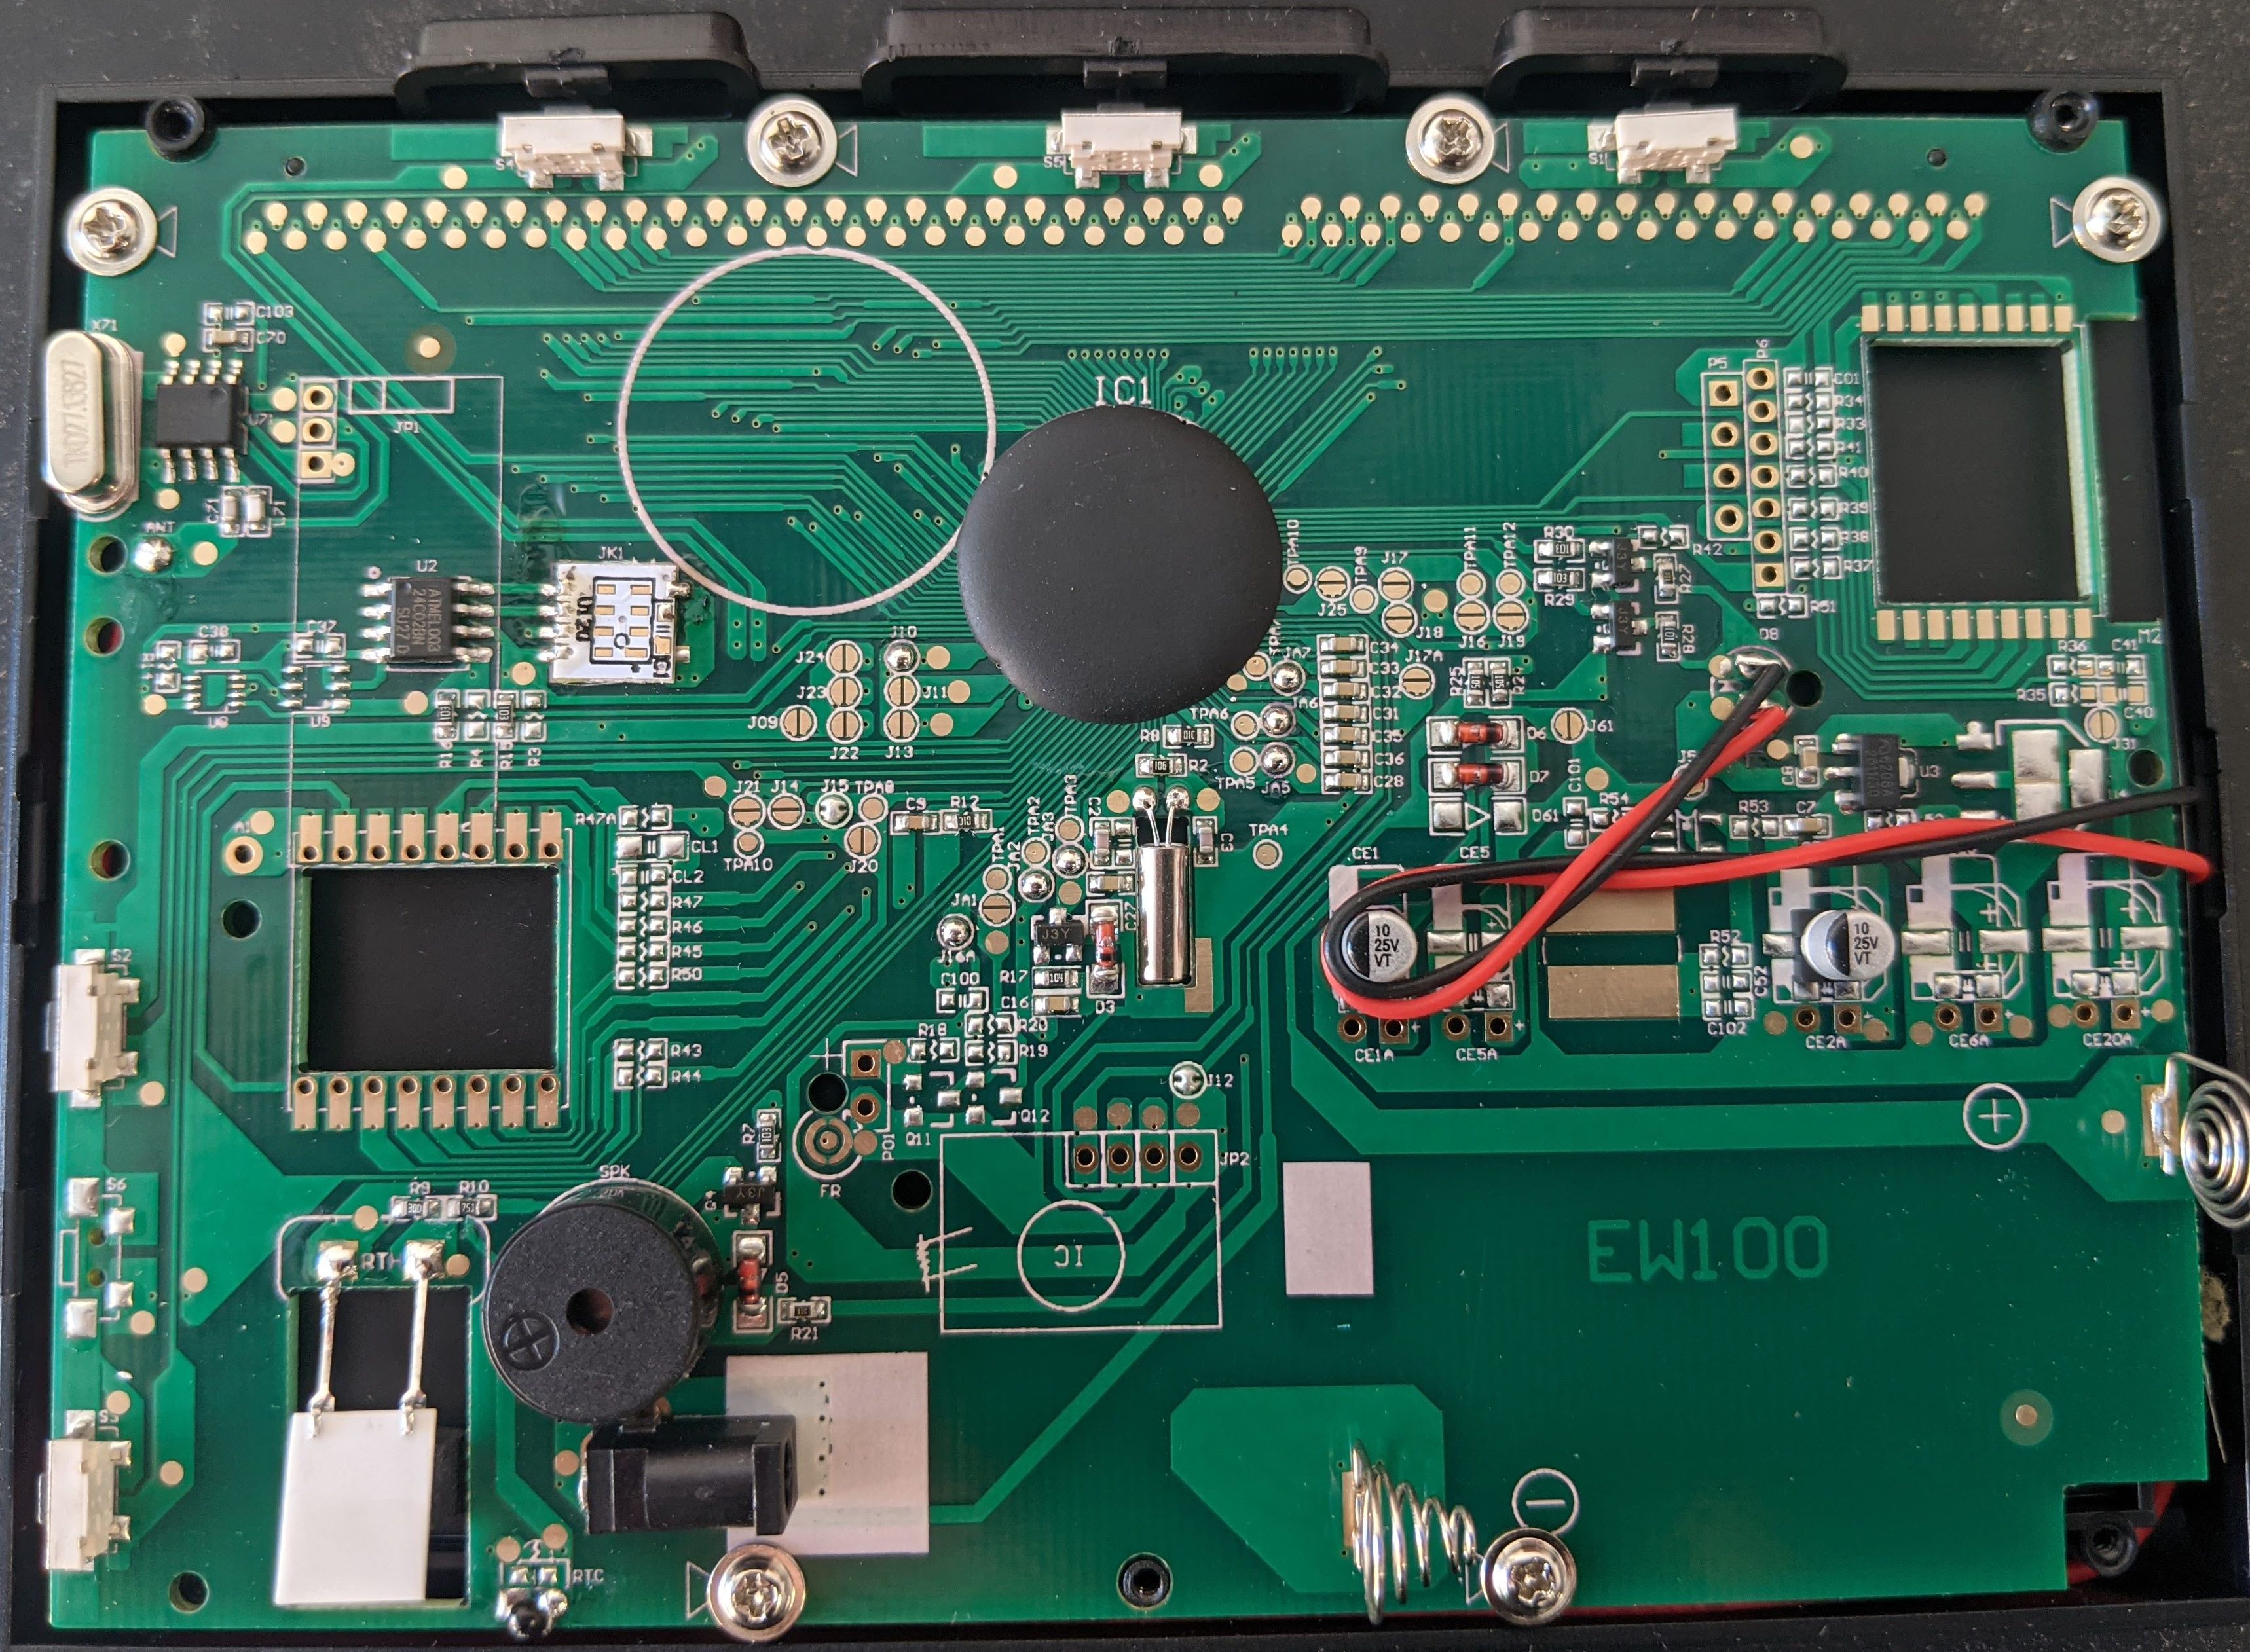
There’s a few things that jump out:
- There’s quite a few unpopulated components. It’s likely these would hold the WiFi, or other sensor chips for the more expensive models
- There’s an antenna looking thing in the lower left side marked RTH. Chli on Github pointed out: “RTH probably stands for Relative Humidity and the part is a capacitive humidity sensor, maybe a “CON-EFS10” or a similar part.”
- There’s two labeled ICs U2 and U71, and the other ones appear to be power related.
- The big block blob is probably where most of the processing occurs
- The 4 and 7 pin connectors P5 and P6 look like they could be some sort of debug or programming ports.
I started by googling the labeled chips. U2 is an Atmel 24C02BN EEPROM, good to know, but not too interesting. The other chip appeared to have the label 002 1917dC0691 which didn’t return any results.
From there I started probing the interesting pins with the oscilloscope. I didn’t get any obvious output on P5 or P6, but I did see data signals on the antenna and on the jumpers near U2.
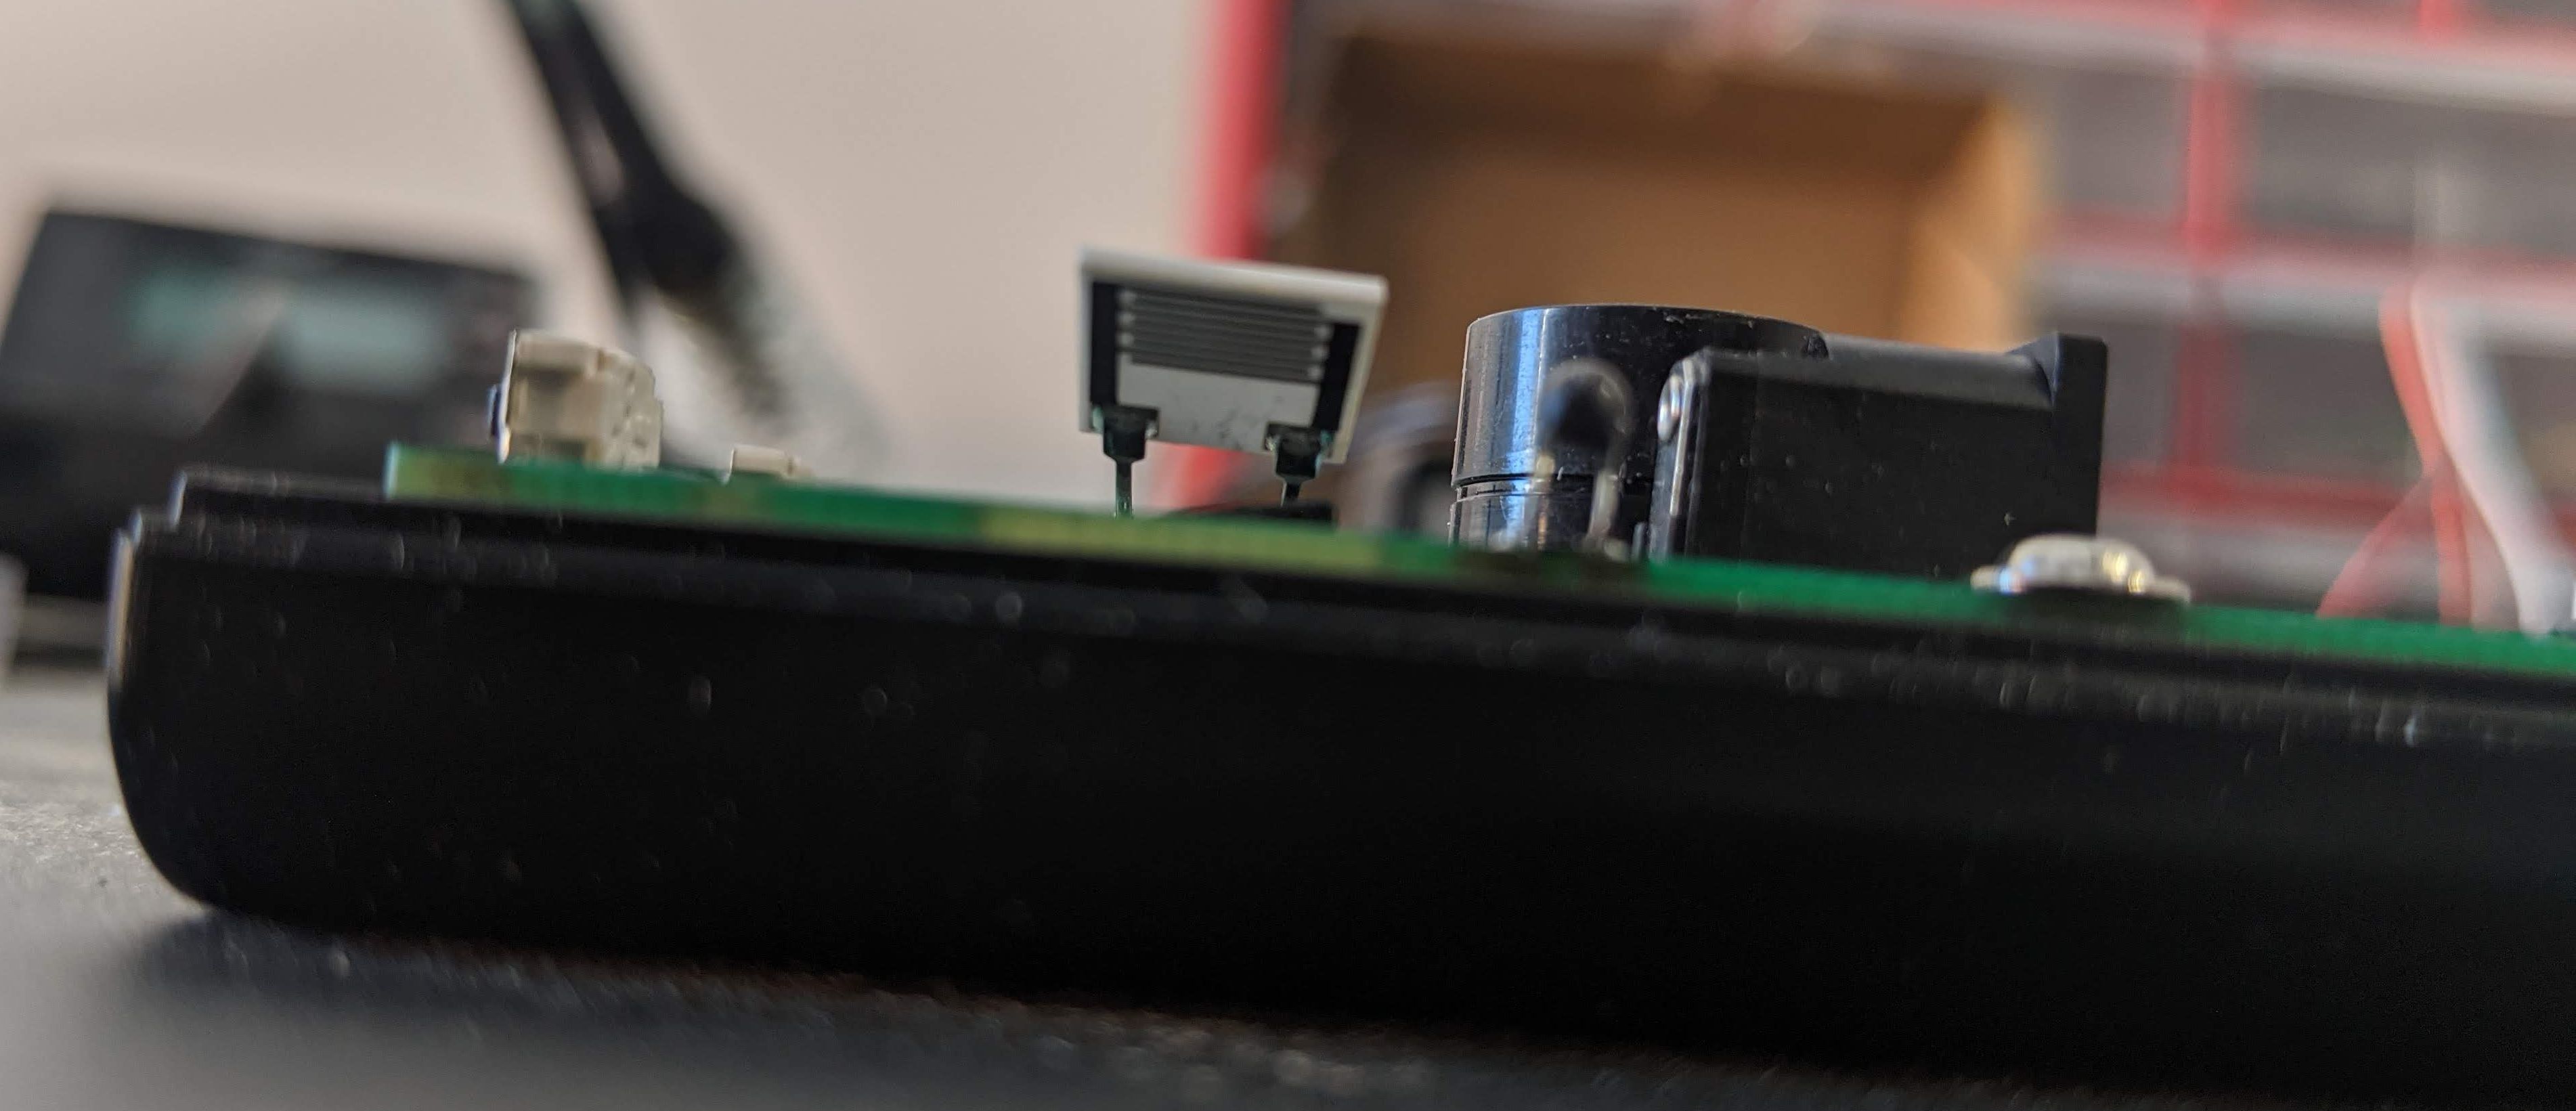
First I looked at the data on this antenna. It appeared to be used for transmission. It clearly had a very different structure to the signal sent out from the sensor, and must be on a different frequency band, since it wasn’t being picked up by the SDR. It might be used to send some instructions back to the sensor, or coordinate multiple sensors. It also might be broadcasting the displays internal measurements. I didn’t end up digging deeper, since I found a more promising lead.
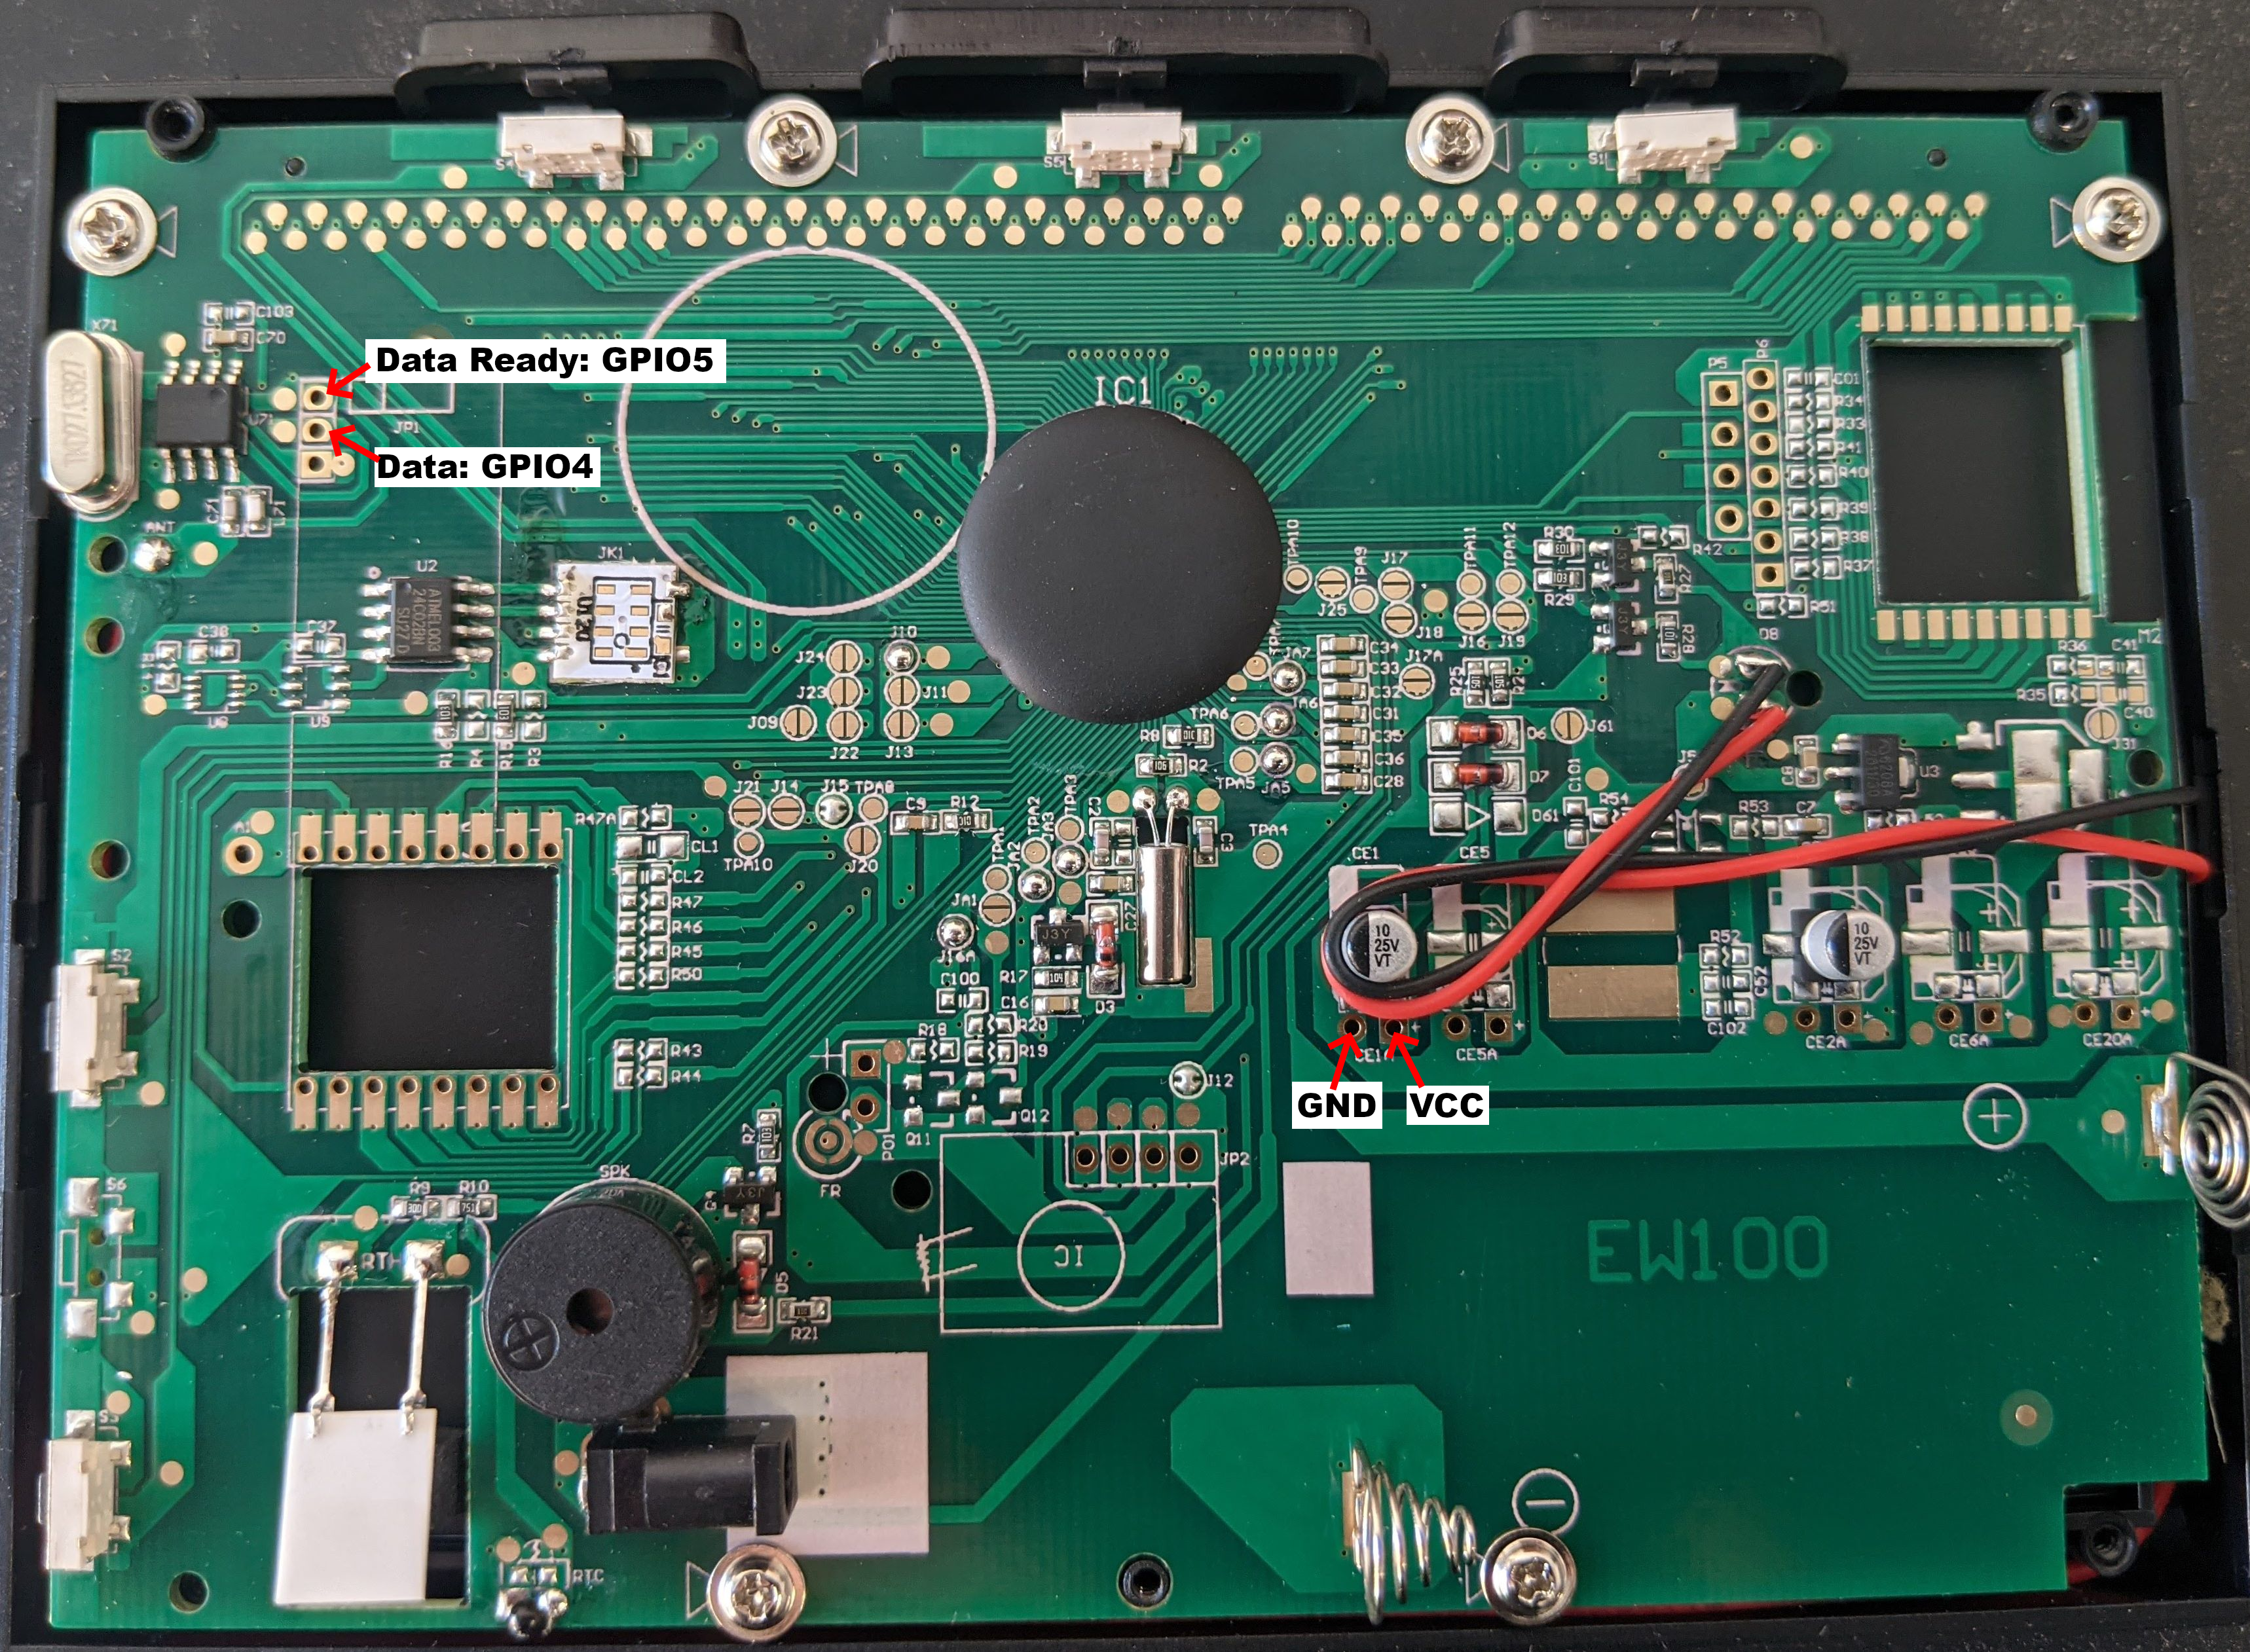
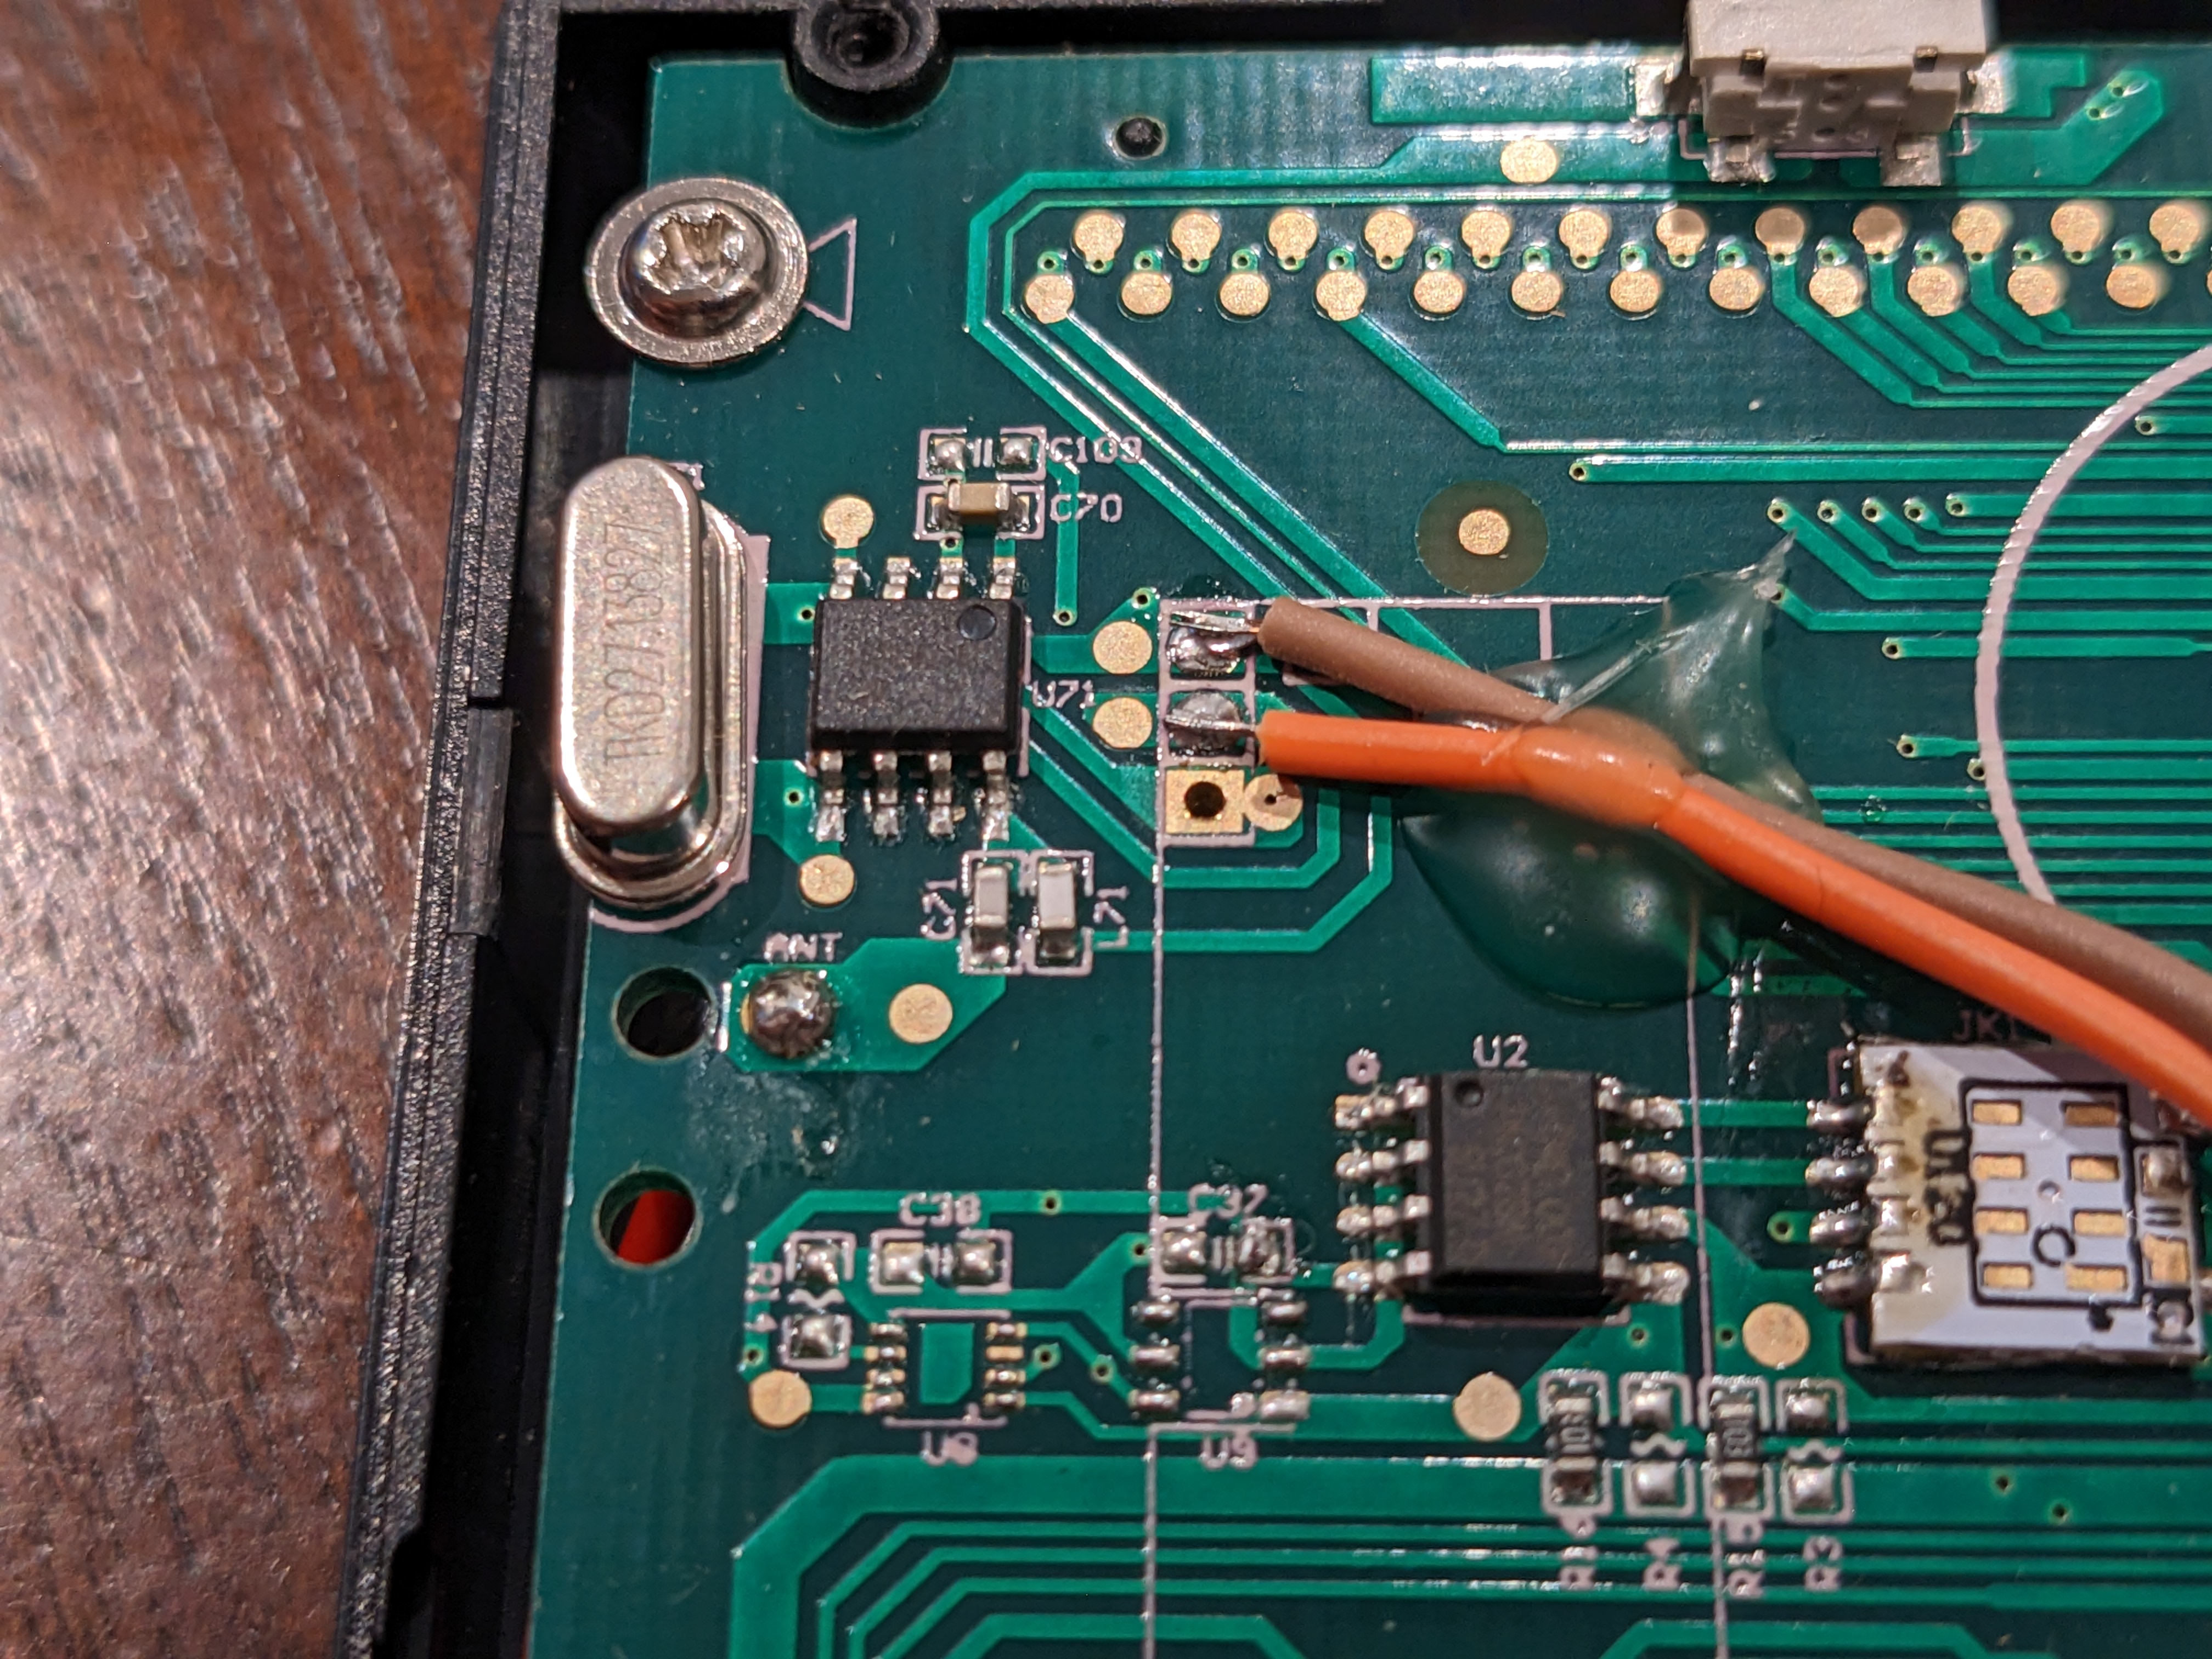
That came when I looked at the jumpers near U71
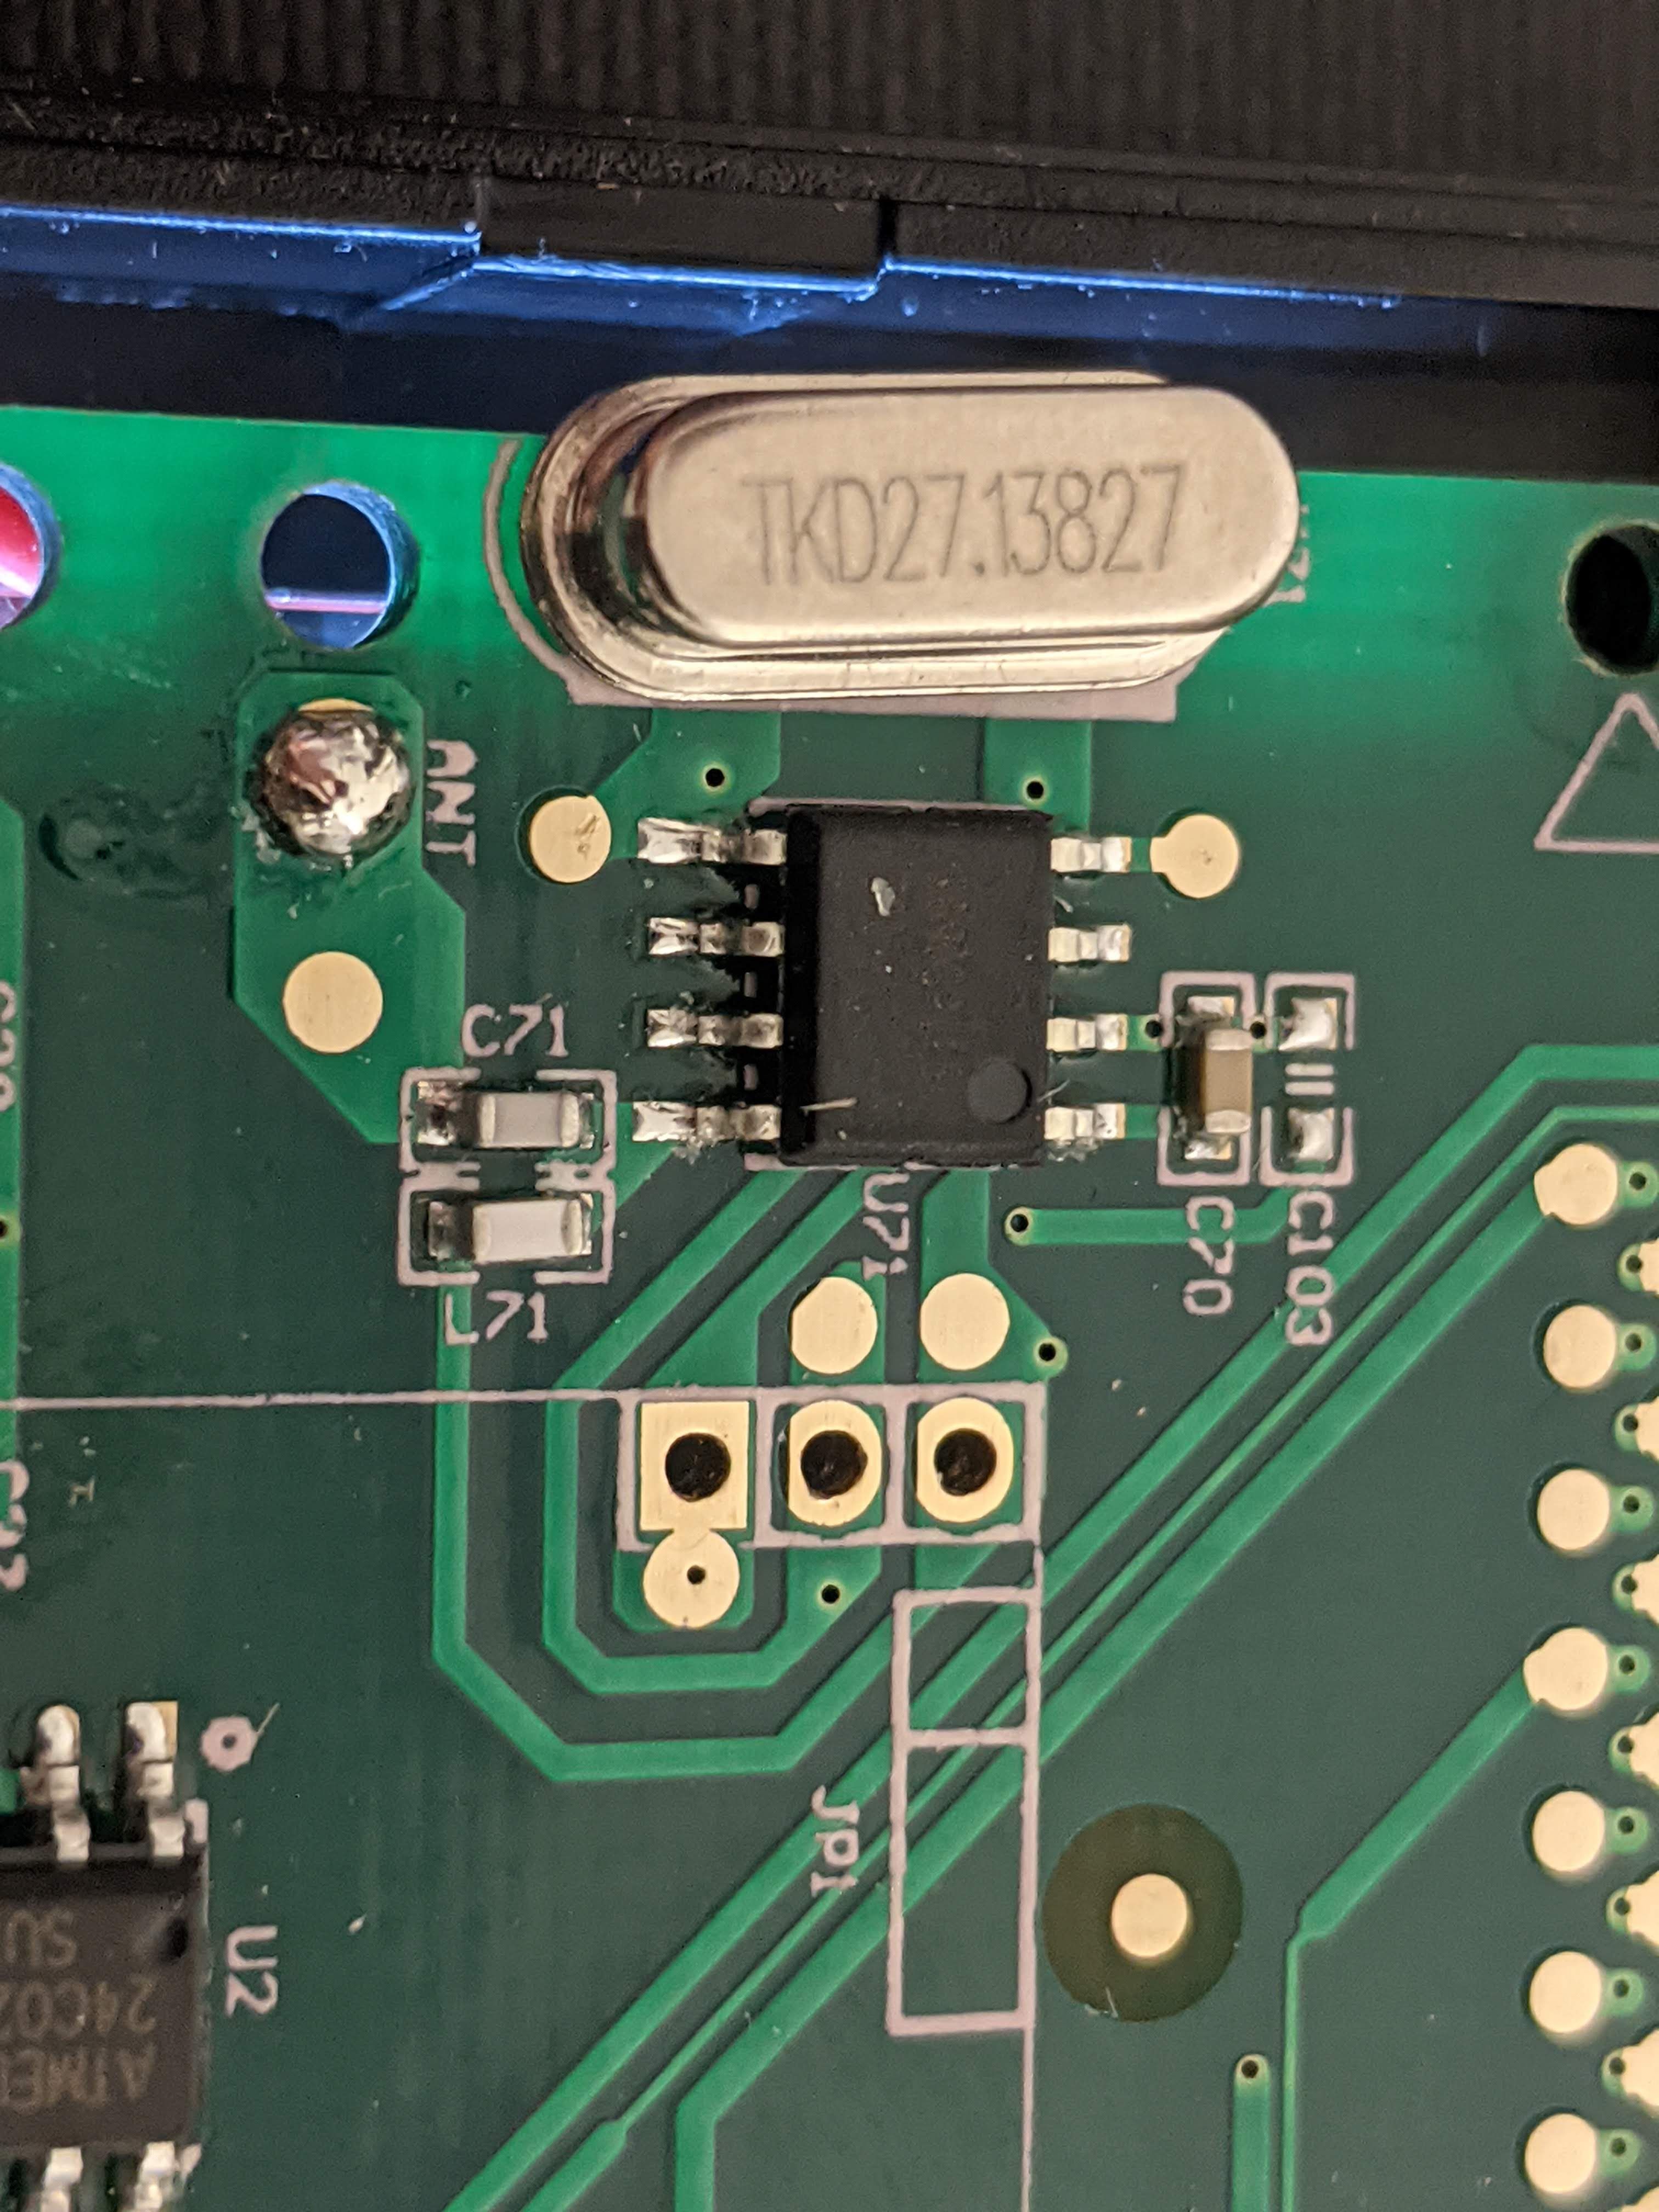
Looking more closely there’s a few give aways this chip is receiving the sensor transmissions. First, the “ANT” label for the antenna. It was just a wire, but still pretty strong evidence. Next is the crystal oscillator. It’s 27.13827MHz which is almost exactly 1/16th of 433.92MHz which means this mystery chip probably has some sort of frequency multiplier.
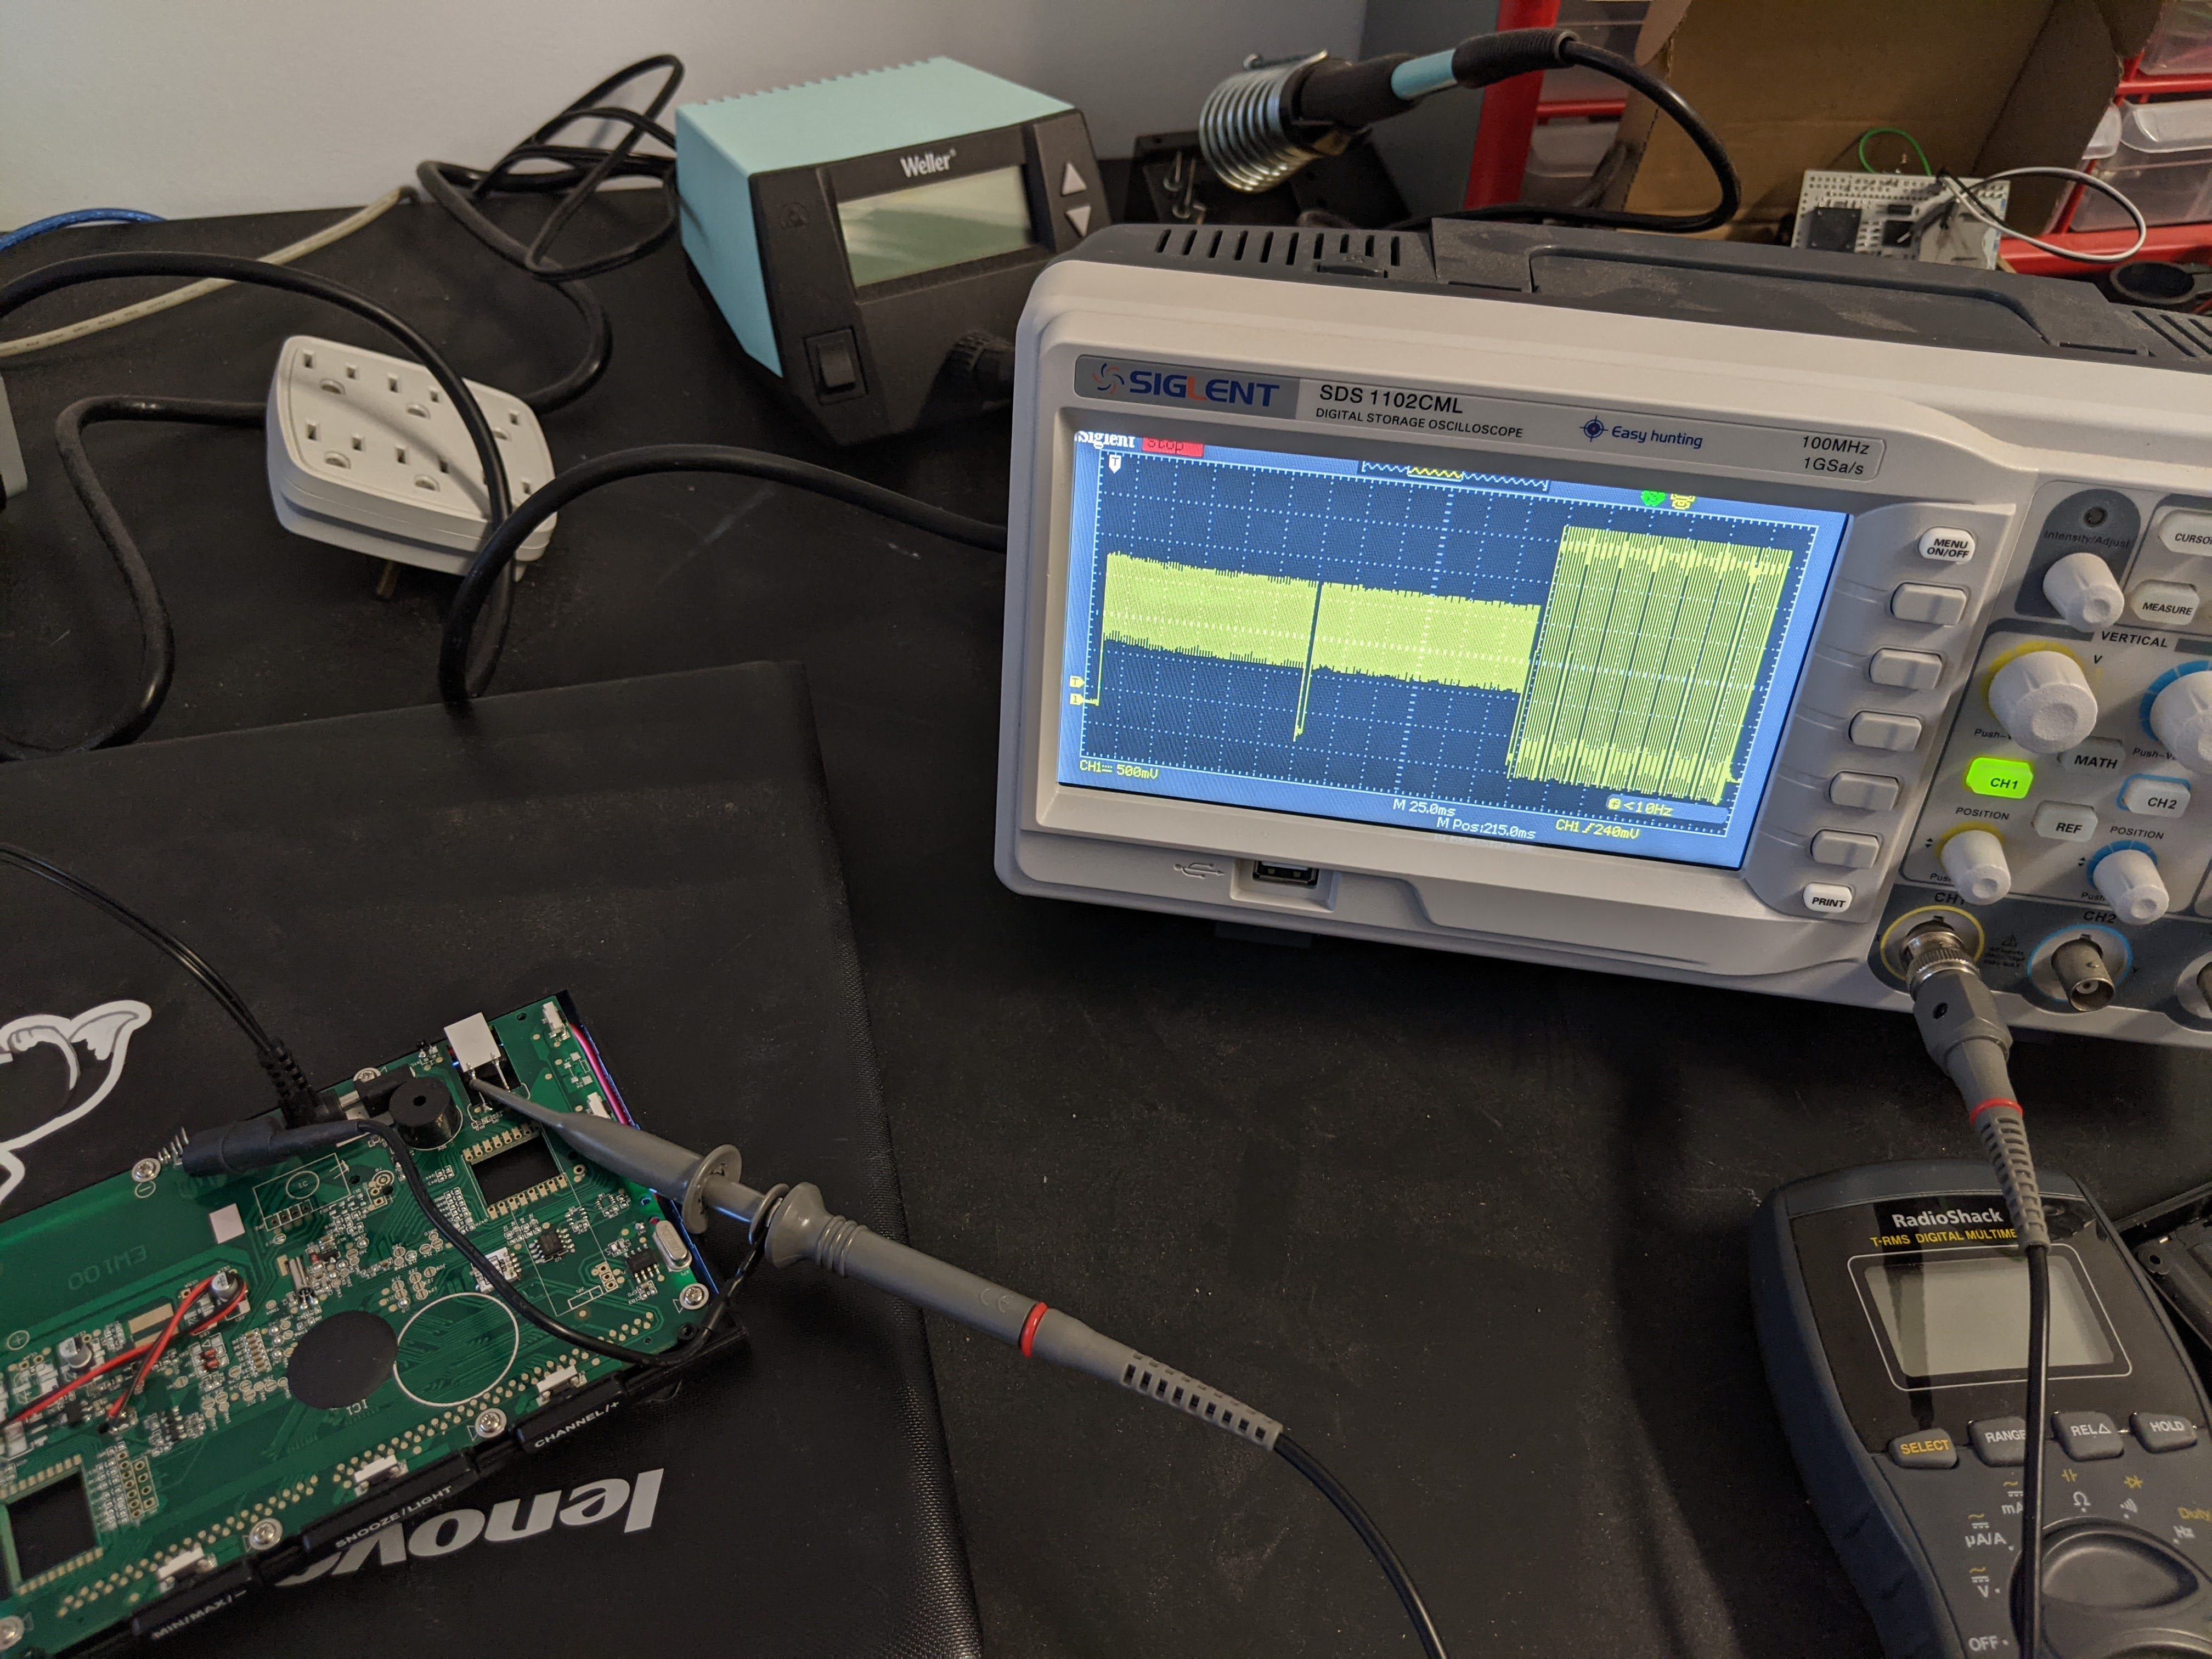
Pins 2 and 3 of the jumper next to this chip showed interesting activity. Pin 3 seemed to go low when a transmission was received with the data being output on pin 2. It seemed like the data on pin 2 was the same I saw with the SDR, but there was additional spurious bits before and after the message. By setting the oscilloscope to capture a single sequence and then saving that the a USB flash drive, I was able to run this data through the same algorithms I’d been using with the SDR and confirm it was the same data.
From there it was a simple matter to attach jumper wires to outputs I was interested in to make a connector for an ESP8266 board. I ended up outputting the two interesting pins along with a power and ground line (I switched jumper wires after an initial test).
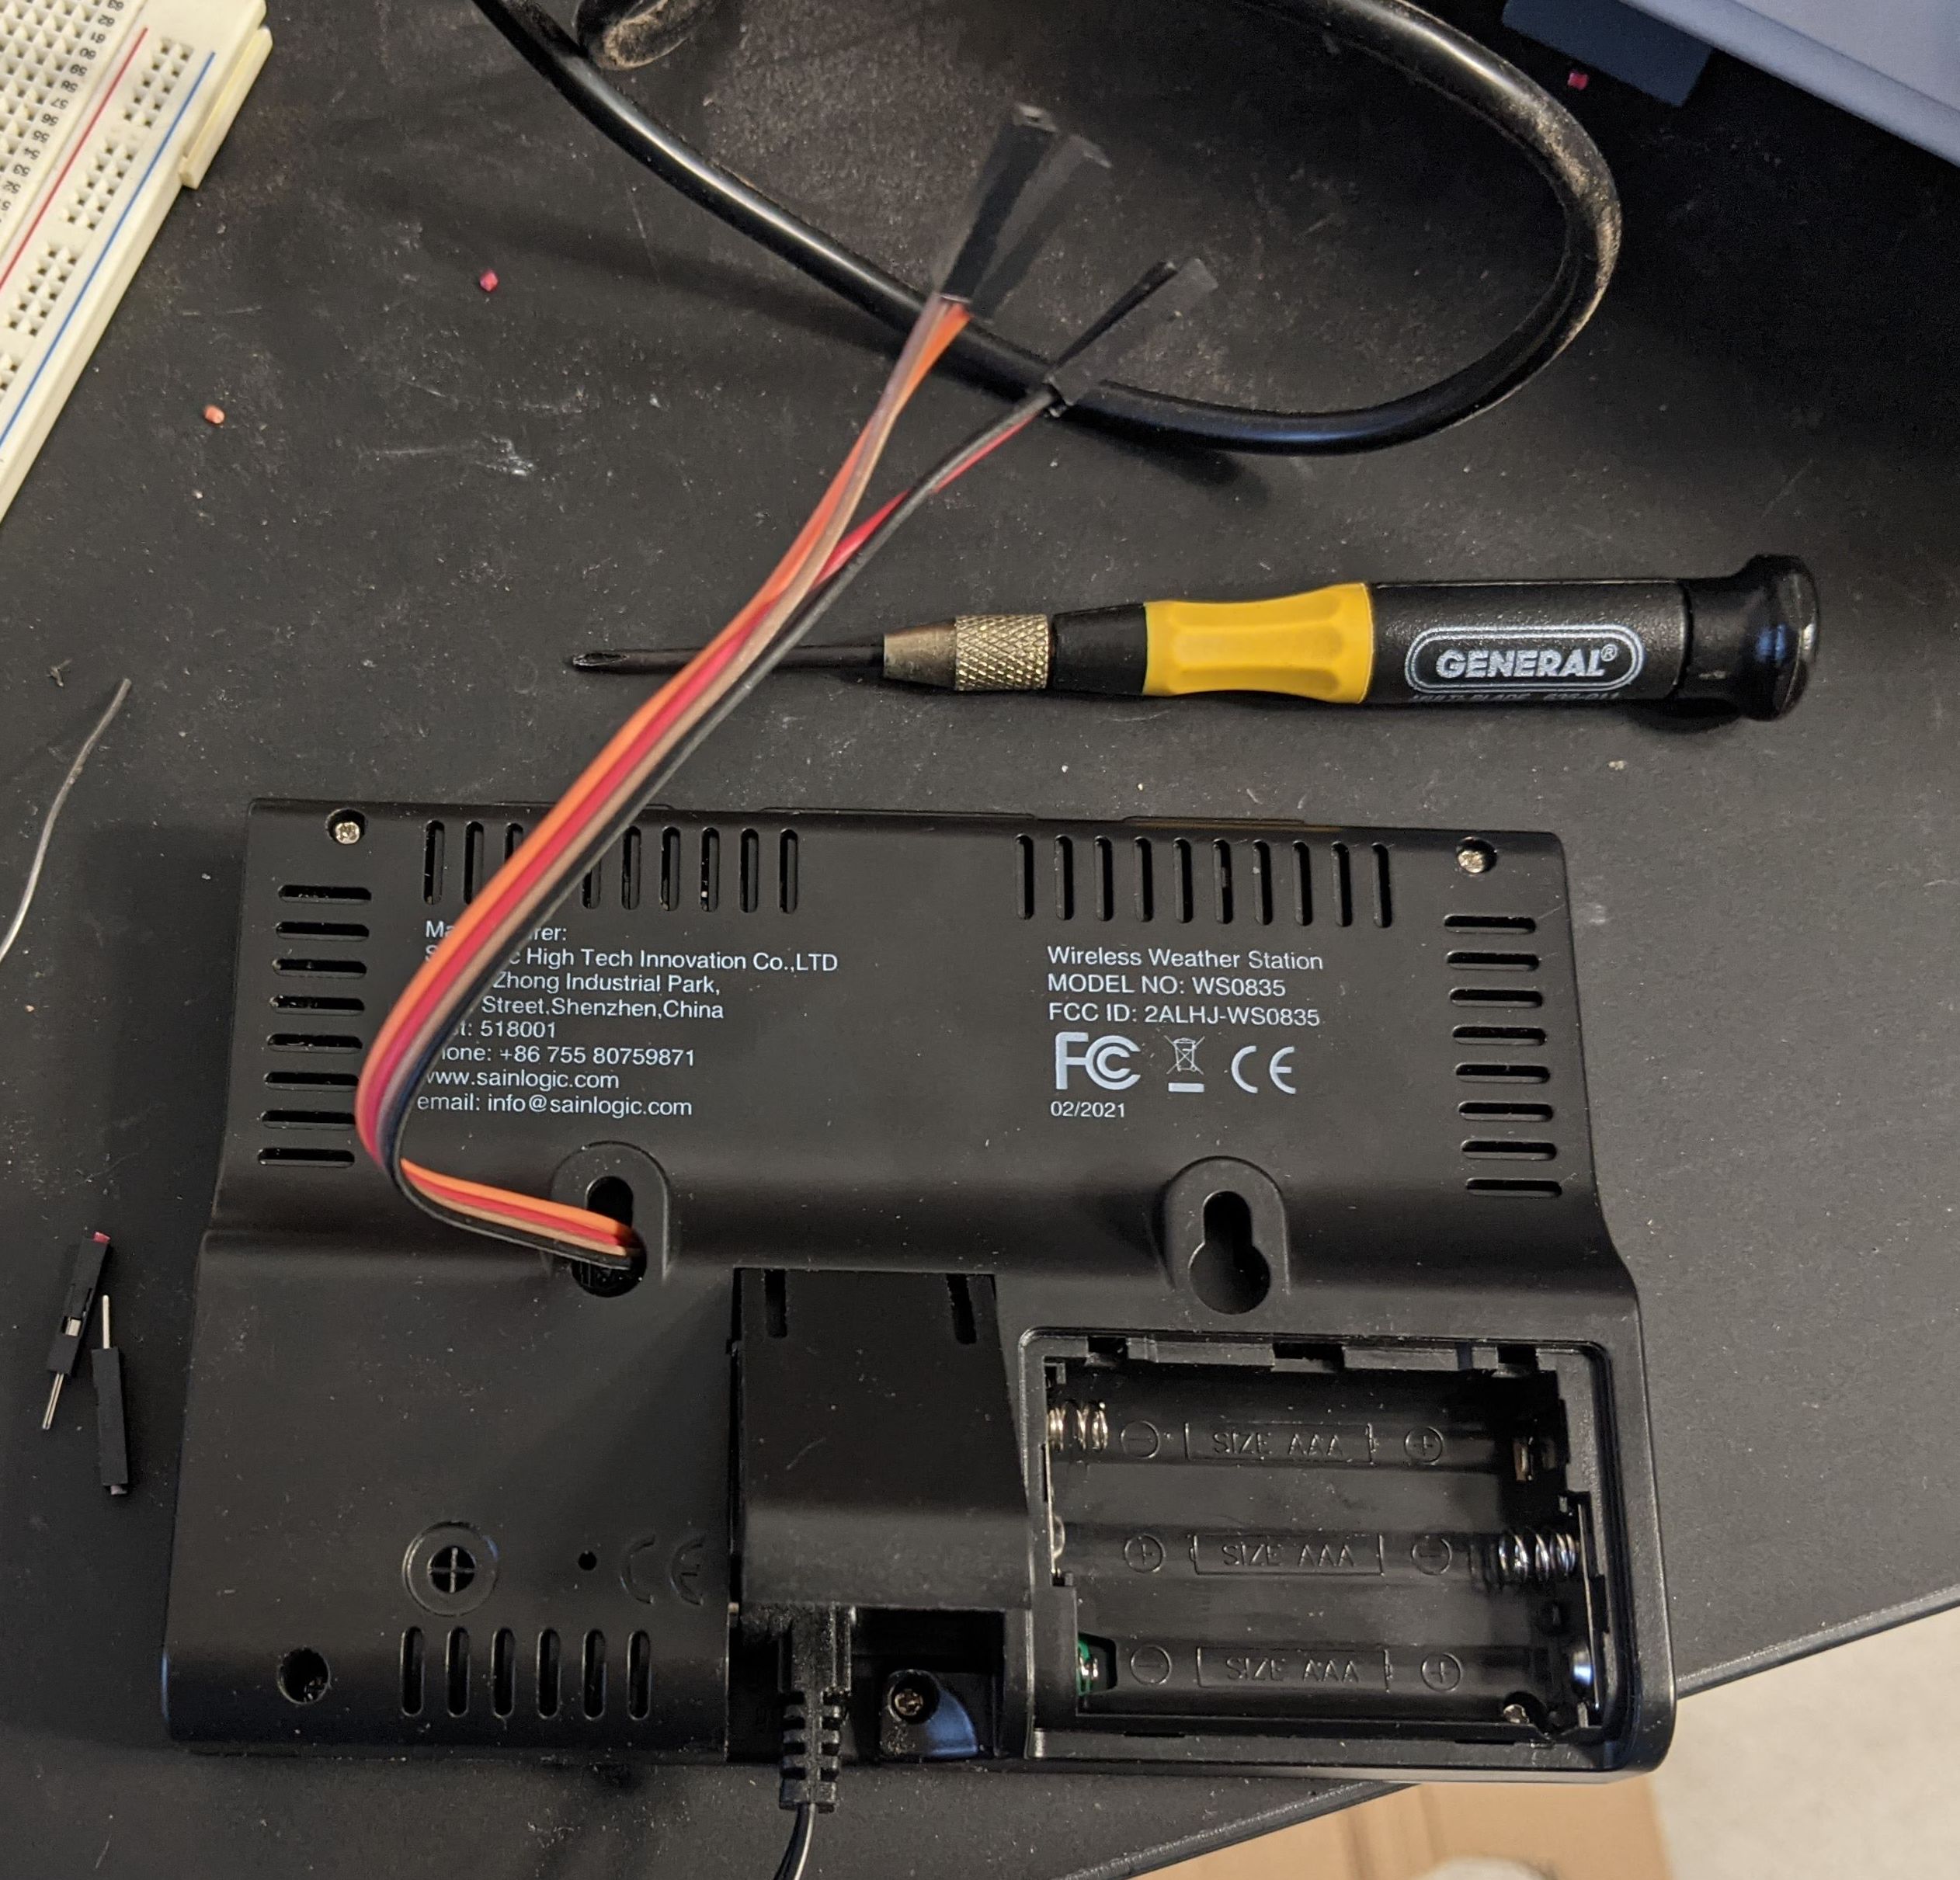
One final mystery with the display board is where its sensors for reporting “indoor” measurements were. It reports temperature, humidity, and barometric pressure. It was pretty hard to get to the back of this board since it was glued to the display, and I couldn’t see any chips when I looked. My guess is that the sensors are integrated into the blob chip.
Creating ESP8266 Monitoring Firmware
Like many of my previous IoT projects, I used a ESP8266 integration board with PlatformIO to create the firmware to at networked data logging to the display https://github.com/axlan/sainlogic-sdr/tree/main/firmware.
For the first time in awhile, I needed to worry about microcontroller timing. Often when working on a microcontroller, you can assume you have fairly deterministic processing (each run through a loop should take a fairly stable amount of time). Initially, I tried to rely on this to sample the input coming from the display, run it through the decoding algorithm, and build up a message’s worth of bits. As I’d shown with the data I captured with the scope, the same algorithms I’d developed with the SDR worked on this signal as well. My initial pass sort of worked, but was failing a lot of the time.
Digging in a bit, it seemed like the code would sometime have a delay between loops. This is likely for the ESP8266 to handle it’s Wifi stack and whatever else it’s doing in the background.
To improve the stability, I switched to using a timer interrupt that would periodically sample the pin and store it in a buffer. Then the main loop would process the buffered data asynchronously.
To debug things and figure out what parameters to use, I also created a debug mode that would basically turn the firmware into a logic analyser. This would capture a continuous block of samples to dump that I could analyze in a python notebook.
I had the ESP8266 subscribe to an MQTT broker running on my LAN. So any application I wanted could listen in. I would see occasional errors, but it looks like I was getting >90% of the messages.
Uploading Results to Weather Underground
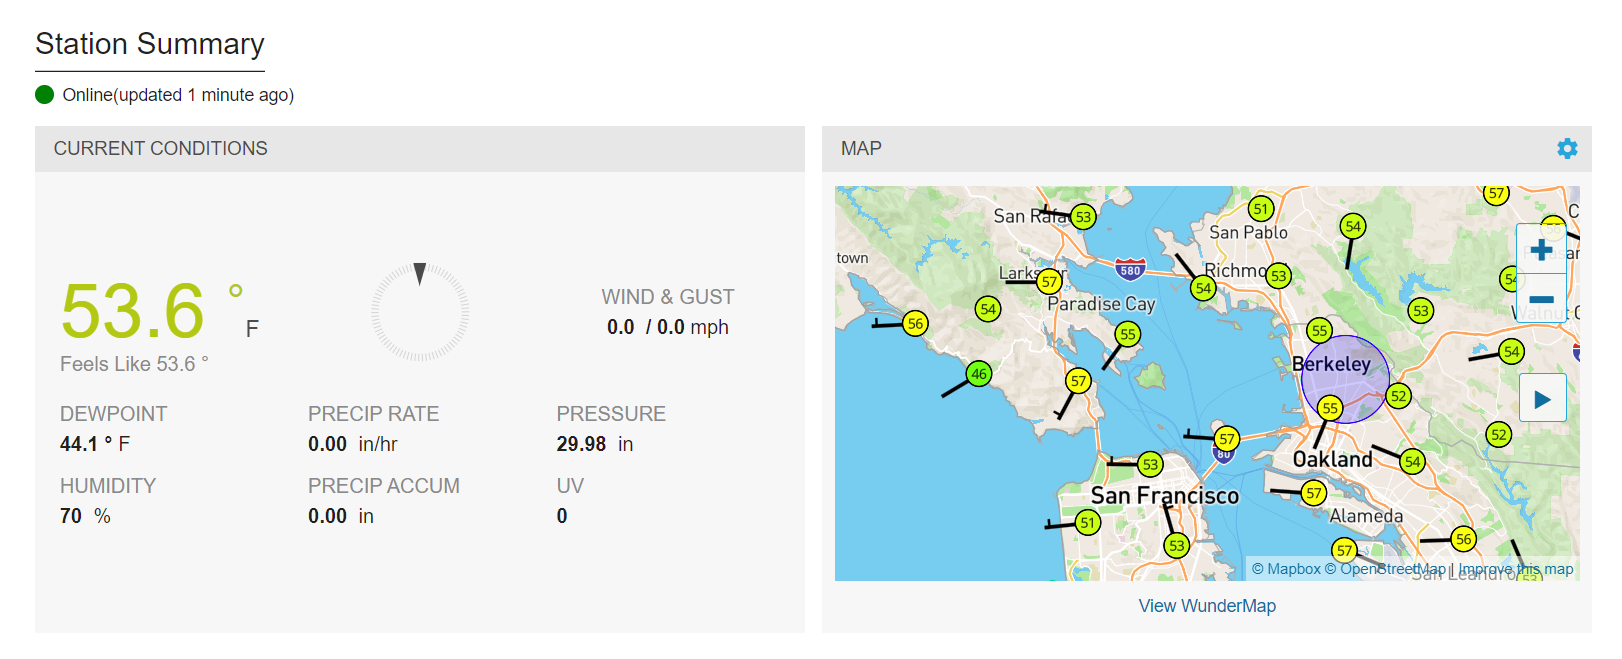
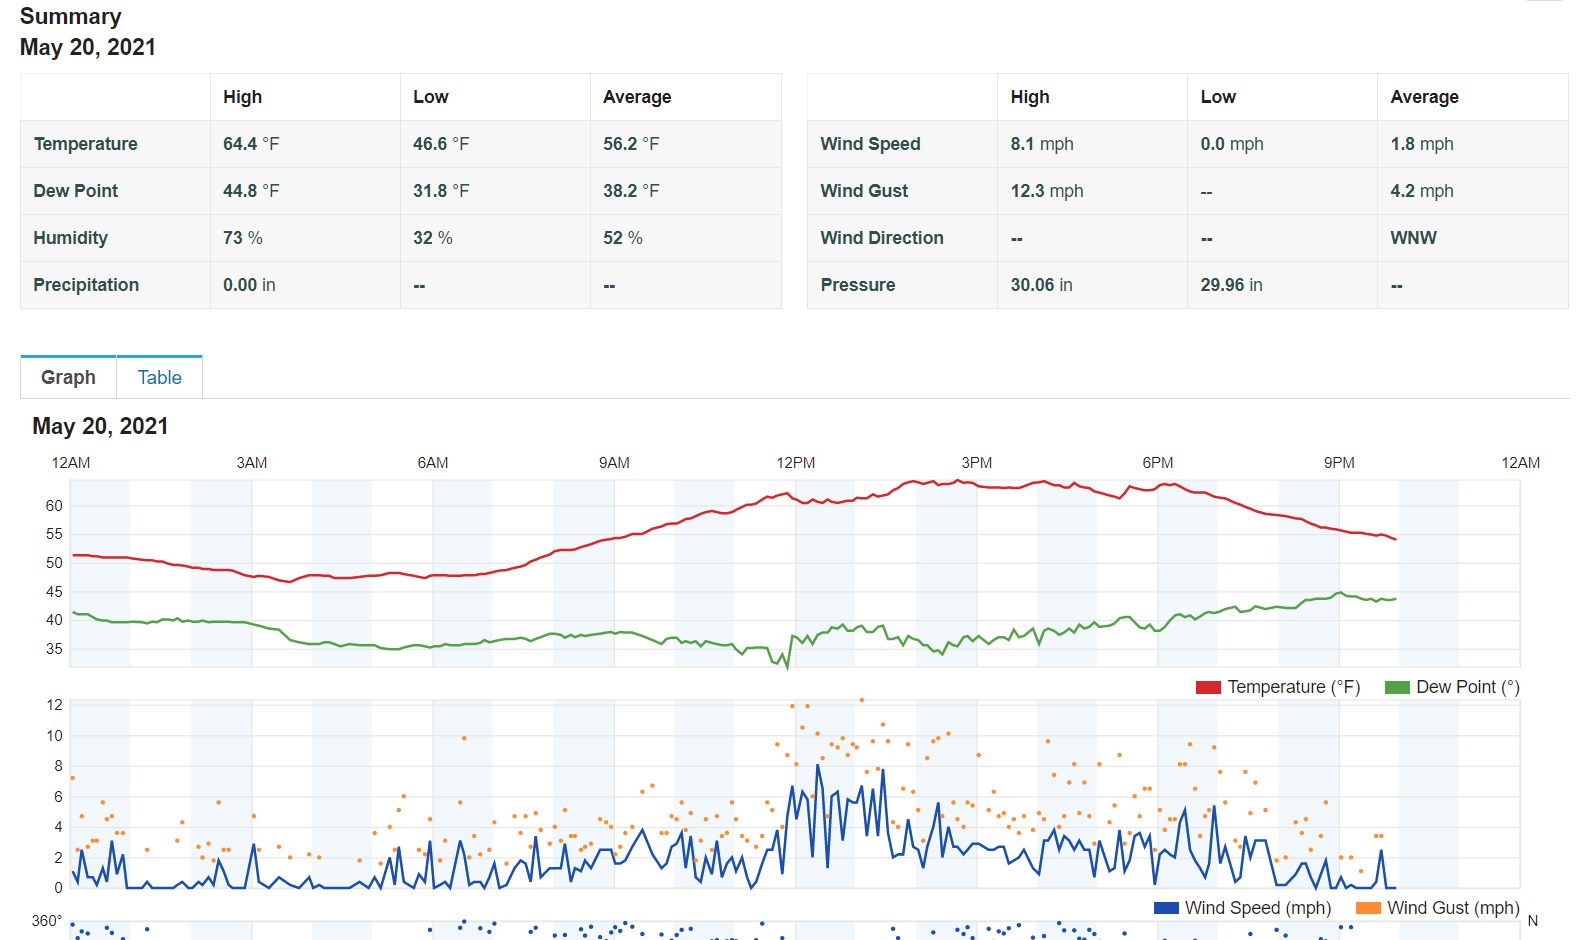
Once this was reliably working, I just needed to decide what to do with the data. I created a client that logged the raw results to a file for future debugging/analysis in https://github.com/axlan/sainlogic-sdr/tree/main/client. I decided that rather then write my own dashboard, I would upload the results to Weather Underground. This was kind of on a whim, since I like the idea of adding home sensors to larger aggregation projects, but I can understand if some folks would think this is a case of giving a big corporation unnecessary personal data.
It doesn’t really take much to set this up. Going to the https://www.wunderground.com/, you need to make an account. With that you can add a device. It gives you a list of weather sensors, but there’s an option for RaspberryPi. You give some basic info about where the station is located and you get an ID and Key to access the API with. I found this guide https://projects.raspberrypi.org/en/projects/uploading-weather-data-to-weather-underground, but really all you need to do is send a GET request based on this reference page https://support.weather.com/s/article/PWS-Upload-Protocol?language=en_US. I added a script to my client code to handle converting and uploading the data, and wrapped it up in a systemd service.
Here’s some pics of the dashboard (not mine):
And with that I completed this very Rube Goldberg-esque dive into setting up a weather station.