
Server Side Site Analytics
I’m removing Google Analytics from my blog, but I’d still like to see view counts. To do this I’m running my own analysis on the HTTP request logs provided by AWS CloudFront.
With Google requiring a migration for their analytics service, I decided now was a good time to bite the bullet and get rid of it. Google doesn’t need my help tracking folks. The only problem is that I get a lot of satisfaction seeing that people are looking at this blog. So to get my “social media engagement” fix, I wanted a way to get similar data without needing to run client side code.
As I mentioned way back in Added SSL to Blog, this site is currently hosted from an AWS S3 bucket behind a CloudFront CDN. CloudFront has a feature where it will log all the requests to an S3 bucket https://docs.aws.amazon.com/AmazonCloudFront/latest/DeveloperGuide/AccessLogs.html.
These logs are written as a compressed CSV file every 5 minutes or so in the “Extended Log File Format” standard. Hypothetically, this means the analysis I’m doing here is generic to any web server that logs requests in this format.
What I Want to Reproduce from Google Analytics
Since I don’t run ads or do anything commercial with this site, I’m just trying to see:
- How much traffic my site gets.
- Which pages are the most popular.
To save the data for posterity, here are the logs since I set up my current blog hosting on AWS.


Here’s the “lifetime” views for the top 25 pages on my site.
| Page | Pageviews | Unique Pageviews | Avg. Time on Page |
|---|---|---|---|
| printing-mtg-cards | 30,275 | 25,803 | 0:04:14 |
| root page | 2,696 | 2,361 | 0:01:31 |
| toy-avr-os | 2,262 | 1,919 | 0:05:15 |
| opencv-camera-effects | 2,062 | 1,709 | 0:04:01 |
| weather-station | 1,596 | 1,289 | 0:04:04 |
| even-more-custom-mtg-cards | 1,331 | 1,147 | 0:02:58 |
| chip-whisperer | 898 | 772 | 0:05:37 |
| cross-compiling | 898 | 847 | 0:06:14 |
| gnuradio-adsb | 809 | 719 | 0:05:15 |
| nest | 683 | 576 | 0:06:08 |
| sql-murder-mystery | 665 | 572 | 0:07:54 |
| tis100-on-fpga | 616 | 548 | 0:02:45 |
| cat-trolly | 611 | 541 | 0:03:22 |
| jindosh-riddle | 532 | 479 | 0:03:57 |
| categories page | 423 | 351 | 0:01:25 |
| icosahedron-travel-globe | 409 | 373 | 0:02:52 |
| cpp-data-memory | 367 | 316 | 0:08:57 |
| portfolio page | 362 | 344 | 0:01:36 |
| roll20-stats | 333 | 291 | 0:06:47 |
| haunted-doll | 305 | 259 | 0:04:22 |
| about page | 293 | 275 | 0:01:39 |
| hacking-ctfs | 285 | 266 | 0:06:46 |
| yo | 260 | 216 | 0:05:53 |
| exapunks-optimization | 235 | 215 | 0:04:13 |
| x86-boot-loading | 232 | 204 | 0:03:30 |
| … | … | … | ……. |
| Total | 55,183 | 47,480 | 0:03:40 |
Which is about 140 days of page view time.
AWS CloudFront Analytics
So it turns out CloudFront has built in analytics. These are accessible from the AWS web console:
There are a couple of problems though:
- They go back a max of 60 days.
- They only track raw requests and not “unique visitors”.
- There’s no API for downloading the data periodically to archive it.
These aren’t huge problems, and would pretty much get me what I wanted. However, I decided to go the extra mile and use the request logging instead. This gives me enough data to roughly replicate most of the additional Google Analytics features.
Limitations and Challenges in Rolling my Own Server Side Analytics
Unfortunately, without any client side code, I’ll have a few challenges reproducing some of the site metrics.
- Unique visitors - While I could try to do something more complicated, I plan on using the IP as a unique identifier for each visitor. While this has some limitations, as long as there isn’t some sort of load balancer or proxy being reported instead of the actual requester, this should be good enough to distinguish unique visitors.
- Bot or not - It would be good to have some sense of how much of my traffic is bot generated. Google Analytics appears to just filter out bot traffic. I have no definitive way to detect bots. However, if a bot isn’t trying to hide itself, the user agent string should identify it. This is a bit of a messy solution though since user agent string can be anything.
- Additional user data - Stuff like the device type, or geographic location. I don’t really care that much, and I can get a decent idea of location from IP address and device type from user agent.
On the other hand, in some ways I might get data I was missing with Google Analytics. Since users with adblock and bots probably don’t run the analytics script I they are probably not accounted for in the Google Analytics results. Since analytics is mostly concerned with serving ads, this isn’t a problem. Here though I can get some rough information that includes these “viewers”.
Enabling and Downloading Logs
I followed the guide in https://docs.aws.amazon.com/AmazonCloudFront/latest/DeveloperGuide/AccessLogs.html to write the logs to an S3 bucket. One gotcha is that the bucket needs “ACLs enabled” to allow the CloudFront service to create files.
I then created a new Policy, Group, and User so I could generate a read only token to access these logs. For reference I used the following policy:
1
2
3
4
5
6
7
8
9
10
11
12
13
14
15
16
17
18
{
    "Version": "2012-10-17",
    "Statement": [
        {
            "Effect": "Allow",
            "Action": [
                "s3:Get*",
                "s3:List*",
                "s3-object-lambda:Get*",
                "s3-object-lambda:List*"
            ],
            "Resource": [
                "arn:aws:s3:::MY_BUCKET_NAME",
                "arn:aws:s3:::MY_BUCKET_NAME/*"
            ]
        }
    ]
}
With the AWS CLI using the newly generated credentials I could then download the logs with:
aws s3 sync s3://MY_BUCKET_NAME/ out/
Creating a Custom Analytics Dashboard
The code I’ll be discussing can be accessed at: https://github.com/axlan/http_server_log_analytics
To make my own analytics I needed a way of ingesting the request logs, and feeding the data into some sort of visualization. This wouldn’t have been too hard to make totally automated with a website where the data is automatically processed in the backend, but I decided to limit the scope to something that would be easy to run locally. To do this I:
- Keep a local sync of the CloudFront logs.
- Use these to generate a CSV with the data I’m interested in.
- Feed this CSV into a dashboard app to generate and view the analytics.
Generating the Intermediate Data
I went back and forth on this a bit since if I wanted this to scale, using AWS lambda to push the logs into a DB as they were generated would probably make the most sense. However, I decided that since I wanted to run locally with minimal effort and it’s all string data a plain CSV would be fine.
To generate the CSV I wrote a script that would combined the Cloudfront logs and filter them down to the values of interest. The script is update_combined_logs.py. The only attempt at some efficiency is that it tries to detect if there was a previous run, and append to it instead of reprocessing all the logs.
The intermediate CSV has the:
- Client IP address
- Reverer URL
- Requested URL
- HTTP Status
- Datetime of request
- The device/OS/agent derived from the user agent string
These last values from the user agent string are parsed from https://github.com/ua-parser which is a project that maintains a regex for getting these values for most use cases from a massive regex. It’s the weakest link of my analysis, but seems to do a reasonable job.
Dashboard
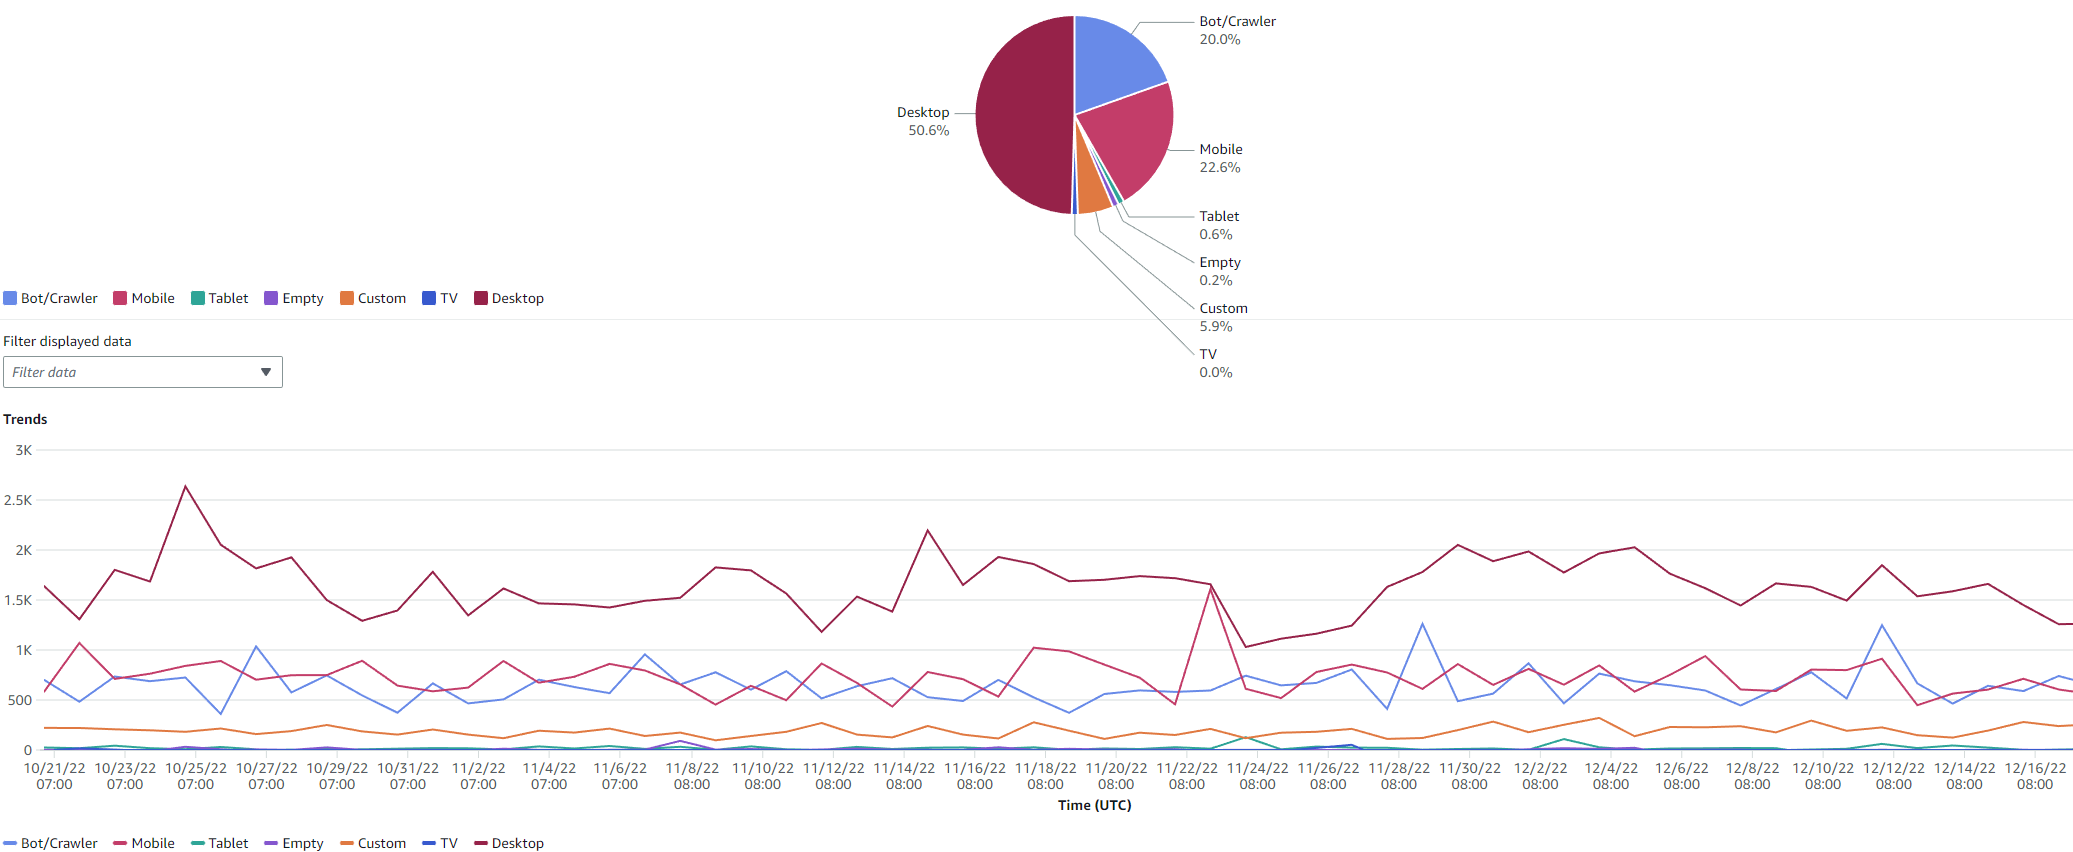
This CSV is then loaded into my dashboard code https://github.com/axlan/http_server_log_analytics/blob/main/run_dashboard.py. Here’s an example:
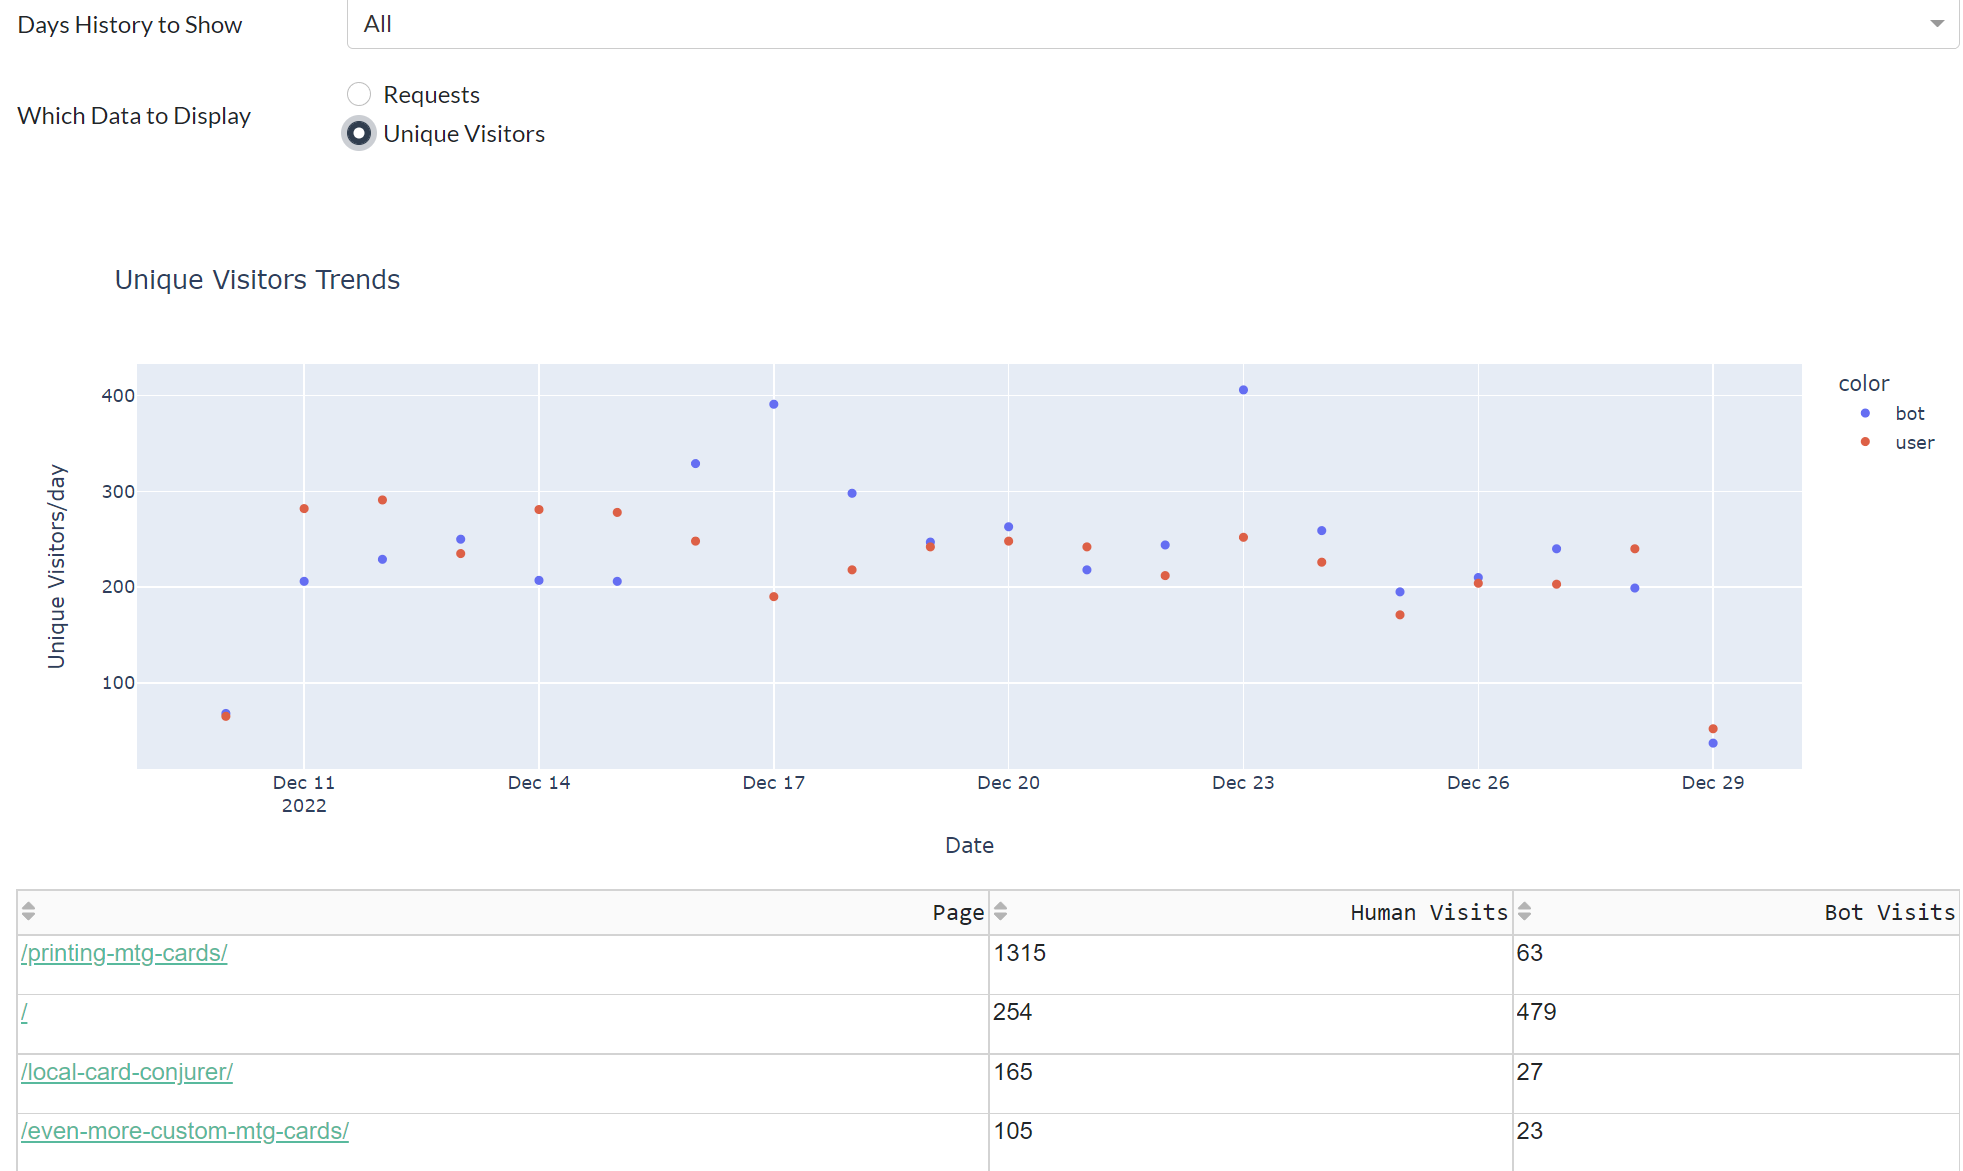
As usual for when I do this sort of thing I went with Plotly Dash. It is pretty bare bones only generating the graphs I really wanted and not bothering to be super efficient. I also load the whole set of requests into memory where I could probably do a lot iteratively if I wanted to.
I made a simple bash script that updates the logs and runs the dashboard. It can take a few minutes or so especially if there are a lot of new logs to process. We’ll see as the dataset grows to years of logs if this is sustainable, or if I need to do a pass at making it more efficient eventually.
Attempted Wordpress Hacking
One interesting thing I noticed was that some of the bots or bots pretending to be real users would attempt to scan the site for Wordpress vulnerabilities. Most would look for /wp-login.php, but some tried as many as 55 different pages. Seems like there are about 10 attempts a day just looking for Wordpress vulnerabilities. They would pretty much all be different IP addresses, and they typically used a user agent string to indicate they were Firefox running on Windows.
Fortunately, since my site is just an S3 bucket, I’m not too concerned.